Striped unifrac: enabling microbiome analysis at unprecedented scale
- Select a language for the TTS:
- UK English Female
- UK English Male
- US English Female
- US English Male
- Australian Female
- Australian Male
- Language selected: (auto detect) - EN
Play all audios:
Access through your institution Buy or subscribe TO THE EDITOR — The UniFrac metric is used frequently in microbiome research, but it does not scale to today’s large datasets. We propose a
new algorithm, Striped UniFrac, which produces results identical to those of previous algorithms but requires dramatically less memory and computing power. A BSD-licensed implementation is
available that produces a C shared library linkable by any programming language (Supplementary Software and https://github.com/biocore/unifrac). UniFrac1 is a phylogenetic distance metric
used to compare pairs of microbiome profiles. Microbiome studies now encompass tens of thousands of samples, such as the 27,751-sample Earth Microbiome Project (EMP)2 and the 15,096-sample
American Gut Project3. Existing algorithms for UniFrac computation cannot scale in time or space to these study designs. For example, Fast UniFrac with the EMP was projected to take months.
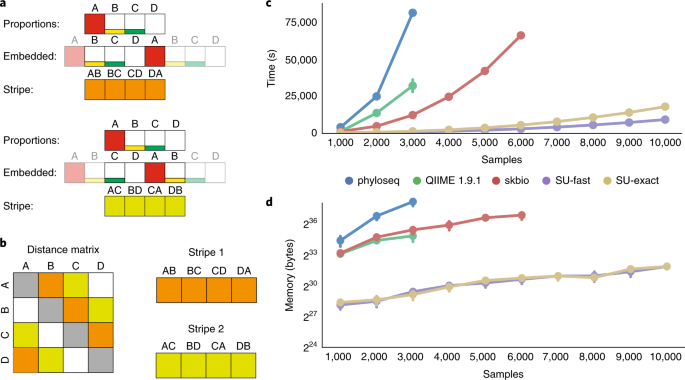
Striped UniFrac produces results identical to those of other existing algorithms, shows >30-fold improvement in single-threaded performance and near-linear parallel scaling (Supplementary
Fig. 1a,b), and can process the EMP dataset on a laptop in less than 24 hours. It can enable scientists to derive new biological insights, as shown by a meta-analysis3 of the American Gut
Project and EMP. To demonstrate the utility of the algorithm, we computed UniFrac on 113,721 public samples in Qiita4 in less than 48 hours using 256 CPUs (an interactive plot is available
at https://bit.ly/2LHMDFC). This is a preview of subscription content, access via your institution RELEVANT ARTICLES Open Access articles citing this article. * ENVIRONMENTAL AND STRUCTURAL
FACTORS ASSOCIATED WITH BACTERIAL DIVERSITY IN HOUSEHOLD DUST ACROSS THE ARIZONA-SONORA BORDER * Lauren D. Benton * , Nicolas Lopez-Galvez * … Paloma I. Beamer _Scientific Reports_ Open
Access 04 June 2024 * UNVEILING THE DYNAMICS OF THE BREAST MILK MICROBIOME: IMPACT OF LACTATION STAGE AND GESTATIONAL AGE * Parul Singh * , Noora Al Mohannadi * … Souhaila Al Khodor
_Journal of Translational Medicine_ Open Access 06 November 2023 * OLIGOFRUCTOSE IMPROVES SMALL INTESTINAL LIPID-SENSING MECHANISMS VIA ALTERATIONS TO THE SMALL INTESTINAL MICROBIOTA *
Savanna N. Weninger * , Chloe Herman * … Frank A. Duca _Microbiome_ Open Access 02 August 2023 ACCESS OPTIONS Access through your institution Access Nature and 54 other Nature Portfolio
journals Get Nature+, our best-value online-access subscription $32.99 / 30 days cancel any time Learn more Subscribe to this journal Receive 12 print issues and online access $259.00 per
year only $21.58 per issue Learn more Buy this article * Purchase on SpringerLink * Instant access to full article PDF Buy now Prices may be subject to local taxes which are calculated
during checkout ADDITIONAL ACCESS OPTIONS: * Log in * Learn about institutional subscriptions * Read our FAQs * Contact customer support DATA AVAILABILITY The datasets analyzed during the
current study are available in the Qiita repository with the specific study accessions in Supplementary Data 1, and were extracted with Qiita’s redbiom interface. REFERENCES * Lozupone, C.
& Knight, R. _Appl. Environ. Microbiol._ 71, 8228–8235 (2005). Article CAS Google Scholar * Thompson, L. R. et al. _Nature_ 551, 457–463 (2017). Article CAS Google Scholar *
McDonald, D. et al. _mSystems_ 3, e00031-18 (2018). Article Google Scholar * Gonzalez, A. et al. _Nat. Methods_ 15, 796–798 (2018). Article CAS Google Scholar * Caporaso, J. G. et al.
_Nat. Methods_ 7, 335–336 (2010). Article CAS Google Scholar * Chang, Q., Luan, Y. & Sun, F. _BMC Bioinformatics_ 12, 118 (2011). Article Google Scholar * Chen, J. et al.
_Bioinformatics_ 28, 2106–2113 (2012). Article CAS Google Scholar * McMurdie, P. J. & Holmes, S. _PLoS One_ 8, e61217 (2013). Article CAS Google Scholar * Amir, A. et al.
_mSystems_ 2, e00191-16 (2017). Article Google Scholar Download references ACKNOWLEDGEMENTS This work was supported by the NSF (grant DBI-1565100 to D.M., Y.V.-B., Z.X., A.G., and R.K.;
award 1664803 to D.K and J.M.), the Alfred P. Sloan Foundation (G-2017-9838 to D.M., Y.V.-B., A.G., and R.K.; G-2015-13933 to A.G. and R.K.), ONR (grant N00014-15-1-2809 to D.M., A.G., and
R.K.), and NIH–NIDDK (grant P01DK078669 to A.G. and R.K.). This work was partially supported by XSEDE resource grant BIO150043. Additional support was provided by CRISP, one of six centers
in JUMP, a Semiconductor Research Corporation (SRC) program sponsored by DARPA. AUTHOR INFORMATION Author notes * Nicolai Reeve Present address: Biota Technology Inc., La Jolla, CA, USA
AUTHORS AND AFFILIATIONS * Department of Pediatrics, University of California, San Diego, La Jolla, CA, USA Daniel McDonald, Yoshiki Vázquez-Baeza, Nicolai Reeve, Zhenjiang Xu, Antonio
Gonzalez & Rob Knight * Mathematics Department, Oregon State University, Corvallis, OR, USA David Koslicki & Jason McClelland * Department of Computer Science and Engineering,
University of California, San Diego, La Jolla, CA, USA Rob Knight * Center for Microbiome Innovation, University of California, San Diego, La Jolla, CA, USA Rob Knight * Department of
Bioengineering, University of California, San Diego, La Jolla, CA, USA Rob Knight Authors * Daniel McDonald View author publications You can also search for this author inPubMed Google
Scholar * Yoshiki Vázquez-Baeza View author publications You can also search for this author inPubMed Google Scholar * David Koslicki View author publications You can also search for this
author inPubMed Google Scholar * Jason McClelland View author publications You can also search for this author inPubMed Google Scholar * Nicolai Reeve View author publications You can also
search for this author inPubMed Google Scholar * Zhenjiang Xu View author publications You can also search for this author inPubMed Google Scholar * Antonio Gonzalez View author publications
You can also search for this author inPubMed Google Scholar * Rob Knight View author publications You can also search for this author inPubMed Google Scholar CONTRIBUTIONS D.M. designed
Striped UniFrac, planned the study, analyzed data, and wrote the manuscript. Y.V.-B. integrated Striped UniFrac with QIIME 2 and contributed to the manuscript. D.K. and J.M. contributed to
the proof. N.R. contributed language interface code. Z.X. contributed to the manuscript. A.G integrated Striped UniFrac with Qiita. R.K. planned the study and wrote the manuscript.
CORRESPONDING AUTHOR Correspondence to Rob Knight. ETHICS DECLARATIONS COMPETING INTERESTS R.K. is a founder and CSO of Biota Technology Inc. D.M. is a consultant with Biota Technology Inc.
INTEGRATED SUPPLEMENTARY INFORMATION SUPPLEMENTARY FIGURE 1 PARALLEL SCALING AND HEURISTIC CORRELATIONS. (A-B) Walltime and memory distributions of independent processes operating on the
full Earth Microbiome Project dataset (_n_ = 26,181) executing on shared compute nodes. An individual partition represents a single independent process, and each process was run with two
threads; 32 partitions indicates 32 processes using two threads each. A higher partition count means each individual process is doing less work. Box plots show the median, whiskers are 1.5
times the proportion of the interquartile range past the 25th and 75th percentiles; the number of data points in each box plot is the number of partitions in the processing run. (C) An
empirical assessment of the number of proportion vectors required to be retained in memory over increasing tree sizes. This assessment was performed by randomly sampling tips from the
Greengenes 99% OTU tree, and counting the maximum number of nodes required to hold proportion vectors resident in memory. Box plots show the median, whiskers are 1.5 times the proportion of
the interquartile range past the 25th and 75th percentiles; each box plot represents 10 independent experiments. (D) Empirical assessment of the runtime of Striped UniFrac for 1,024 samples
over increasing numbers of tips in a phylogeny. (E) Mantel tests (Pearson) between Striped UniFrac in exact mode, which produces identical results to UniFrac, versus fast mode, in which the
UniFrac distances are not computed at the tips of the tree during traversal. Each data point represents _n_ = 10 random subsets (independent experiments) of the Earth Microbiome Project
Deblur 90-nt dataset, with the mean R2 value depicted. Error bars are 95% CI around the mean. The figure data can be found in Supplementary Data 3. SUPPLEMENTARY INFORMATION SUPPLEMENTARY
TEXT AND FIGURES Supplementary Figure 1 and Supplementary Note 1 REPORTING SUMMARY SUPPLEMENTARY DATA 1 table_s1.xlsx, the Qiita study accessions used. SUPPLEMENTARY DATA 2
figure1-data.xlsx, the data necessary to re-create panels C and D in Fig. 1. SUPPLEMENTARY DATA 3 figureS1-data.xlsx, the data necessary to re-create Supplementary Fig. 1. SUPPLEMENTARY
SOFTWARE Supplementary SoftwareUnifrac.tar.gz, the version of UniFrac used in the study. RIGHTS AND PERMISSIONS Reprints and permissions ABOUT THIS ARTICLE CITE THIS ARTICLE McDonald, D.,
Vázquez-Baeza, Y., Koslicki, D. _et al._ Striped UniFrac: enabling microbiome analysis at unprecedented scale. _Nat Methods_ 15, 847–848 (2018). https://doi.org/10.1038/s41592-018-0187-8
Download citation * Published: 30 October 2018 * Issue Date: November 2018 * DOI: https://doi.org/10.1038/s41592-018-0187-8 SHARE THIS ARTICLE Anyone you share the following link with will
be able to read this content: Get shareable link Sorry, a shareable link is not currently available for this article. Copy to clipboard Provided by the Springer Nature SharedIt
content-sharing initiative