The role of interconnectivity in control of an ebola epidemic
- Select a language for the TTS:
- UK English Female
- UK English Male
- US English Female
- US English Male
- Australian Female
- Australian Male
- Language selected: (auto detect) - EN
Play all audios:
ABSTRACT Several West African countries - Liberia, Sierra Leone and Guinea - experienced significant morbidity and mortality during the largest Ebola epidemic to date, from late 2013 through
2015. The extent of the epidemic was fueled by outbreaks in large urban population centers as well as movement of the pathogen between populations. During the epidemic there was no known
vaccine or drug, so effective disease control required coordinated efforts that include both standard medical and community practices such as hospitalization, quarantine and safe burials.
Due to the high connectivity of the region, control of the epidemic not only depended on internal strategies but also was impacted by neighboring countries. In this paper, we use a
deterministic framework to examine the role of movement between two populations in the overall success of practices designed to minimize the extent of Ebola epidemics. We find that it is
possible for even small amounts of intermixing between populations to positively impact the control of an epidemic on a more global scale. SIMILAR CONTENT BEING VIEWED BY OTHERS FLEEING
LOCKDOWN AND ITS IMPACT ON THE SIZE OF EPIDEMIC OUTBREAKS IN THE SOURCE AND TARGET REGIONS – A COVID-19 LESSON Article Open access 29 April 2021 A NETWORK MODEL OF ITALY SHOWS THAT
INTERMITTENT REGIONAL STRATEGIES CAN ALLEVIATE THE COVID-19 EPIDEMIC Article Open access 09 October 2020 THE IMPACT OF TRAVEL AND TIMING IN ELIMINATING COVID-19 Article Open access 06
November 2020 INTRODUCTION From late 2013, throughout 2014 and stretching into 2015, the West African countries of Sierra Leone, Guinea and Liberia experienced the most devastating Ebola
virus epidemic to date1,2. While previous outbreaks have been primarily confined to remote villages, this outbreak was much larger in part due to the arrival of the Ebola virus in large
population centers3. Consequently, there were nearly 30,000 suspected cases and over 11,000 deaths over the course of the epidemic, the majority of which occurred in Liberia2. Control of the
outbreak was further hindered by the spread of the virus in three neighboring countries with different public health agendas, varying levels of resources, and, at times, inconsistent
strategies for treating of the disease4,5,6. Successful control of the outbreak in western Africa relied on multifaceted approaches that implement both standard practices for treating cases
(e.g. hospitalization) as well as community interventions (e.g. safe burial practices)1. Previous modeling studies have explored the dynamical impact of such management strategies on the
Ebola epidemic in order to determine the most effective policies (reviewed in ref. 7). In addition to hospitalization and safe burial practices, mathematical models have investigated the
effects of increasing the number of available beds in hospitals, expanding the number of Ebola treatment units (ETUs), accelerating case identification and implementing a quarantine policy
for infected individuals (e.g. ref. 8, 9, 10, 11, 12, 13, 14, 15). However, these studies have assumed that treatment and prevention methods are implemented homogeneously within a population
or introduce them within stochastic models of disease spread (e.g. ref. 16, 17, 18, 19). Here, we determine the effectiveness of interventions when interacting populations implement
policies that have not been coordinated. Specifically, we consider a two-patch model that is connected by varying levels of movement between patches. Each patch alone may employ some
combination of hospitalization, quarantine or enhanced burial safety to mitigate the spread of infections, but the policy in an individual patch has no bearing on that of a neighboring
patch, despite the movement of individuals between the two areas. Through variation of several parameters related to disease management, we determined regions of parameter space that permit
successful control. We first assumed that one population maximized the potential benefits of either (_I_) hospitalization, (_II_) hospitalization and safe burial practices, or (_III_)
quarantine and safe burial practices. In contrast, the other population implemented varying levels of these management practices. We additionally considered a scenario in which populations
used a combination of both hospitalization and quarantine. We find that the positive benefits of effective intervention in one population can help overcome poor strategies in a connected
population, which can lead to elimination of the pathogen on a more global scale (i.e. elimination in both populations). This holds for even low levels of movement between populations. In
contrast, the same population with poor strategies would experience disease persistence in the absence of connectivity. Therefore, the interconnectedness of regions, without regard to nation
boundaries and policies, is an essential consideration for a coordinated response to emerging infections. THEORETICAL FRAMEWORK We begin by introducing a transmission model of Ebola virus
that ignores spatial structure but divides infectious individuals into groups based on their treatment status, allowing for variation in the infectivity arising from different treatment
methods. Next, we introduce spatial structure into our model by including two populations that are connected by movement of individuals. Flexibility is embedded in the structured model to
allow for potentially different treatment strategies between populations. Additionally, we derive the basic reproductive number for both the non-spatial and spatial models. MODEL WITHOUT
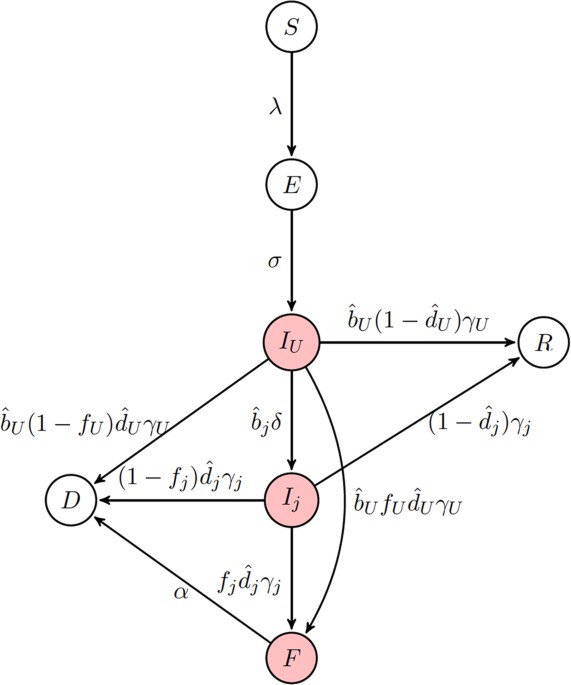
EXPLICIT SPACE Our initial modeling framework considers an _SEIR_-type model in the absence of explicit space (Fig. 1). We assume that living infectious individuals can fall into one of
three classes: infectious but untreated (_I__U_, hereafter referred to as ‘undetected’), infectious but hospitalized (_I__H_), or infectious but quarantined (_I__Q_). Here, quarantine is
only meant to indicate the complete isolation of infected individuals, not the separation of potentially infectious individuals from the general population. We assume that disease
transmission only occurs from living individuals that are either undetected or hospitalized. Additionally, transmission of Ebola may also occur from victims of disease-induced mortality.
This typically occurs during funeral practices prior to burial; therefore, we create a class (_F_) comprised of deceased individuals capable of transmission. Given these different
transmission routes, the overall force of infection is given by: where β_U_, β_H_ and β_F_ are the _per capita_ transmission rates from individuals in the undetected, hospitalized and
funeral classes, respectively. We assume that hospital treatment diminishes an individual’s overall infectivity so that β_H_ ≤ β_U_. In our model, _N__k_ is the total number of individuals
in the population capable of contributing to onward infection including those in the funeral class, but excluding those who are quarantined (_I__Q_) and effectively removed (_D_) from the
population. Upon infection, individuals enter an exposed (_E_) class and subsequently become infectious at a rate σ. Under the assumption that the birth and death rates (μ) are equal, where
_N__b_ is the population size of individuals capable of reproduction, i.e. excluding individuals in the funeral and effectively removed classes. After becoming infectious, individuals
initially enter the undetected class and can remain in that class with probability _b__U_ until leaving the class at rate γ_U_. Alternatively, individuals may subsequently enter the
hospitalized or quarantined class with probabilities _b__H_ and _b__Q_, respectively, at a rate δ. These classes can be described as: where γ_H_ and γ_Q_ are the rates at which individuals
leave their respective infectious class. In order to ensure the proper exit rates from our compartments, we follow the convention of Legrand _et al_.10 in our equations but note that is the
fraction of exposed individuals remaining undetected, rather than . Similarly, is the fraction of individuals who are hospitalized and is the fraction of individuals quarantined. Throughout,
parameters with a hat appear in equations, but are not true fractions, while figure axes use the true fraction undergoing a particular intervention. Individuals are assumed to either
succumb to infection (with probability , where _i_ = {_U_, _H_, _Q_} is the respective infectious class) or recover (with probability ). It is assumed that a fraction _f__i_ (where _i_ =
{_U_, _H_, _Q_} is the respective infectious class) of deceased patients are provided with funerals, during which each patient remains capable of transmission. Individuals are then buried
and enter an effectively removed class, _D_, in which they are no longer capable of transmission. Additionally, the remaining fraction 1 − _f__i_ individuals directly enter the _D_ class. We
can describe these processes with the following differential equations: where _j_ = {_H_, _Q_}. Note that is the relative fraction of individuals that remain undetected rather than entering
the hospital or quarantine, so that . The majority of the parameterization of our models is based upon the outbreak of Ebola virus in West Africa, beginning in late 2013 and extending into
2015. Although the incubation period varied slightly among the three countries, the measured mean incubation time across West Africa was 9–12 days20. The serial interval – average time from
symptom onset of the index case to symptom onset of the secondary case – was consistently found to be 14–15 days20. As the mean time in the undetected infectious class (γ_U_) was 10 days20,
the time spent in the hospitalized and quarantined classes was calculated to account for time first spent in the undetected class and the serial interval20. In other words, . The case
fatality of all three countries over the course of the epidemic was ~70%20 with only a minor reduction in the case fatality rate when individuals received palliative care21. The relative
fraction of exposures that result in disease and enter a given infectious class (, , ) varied based on the community of interest. Values for β_U_ and β_F_ were set assuming a reproductive
number _R_0 = 1.85, consistent with estimates of the 2013–2015 Ebola epidemic in West Africa (see Appendix A for more details). Parameters for our models can be found in Table 1.
Importantly, many of the parameters in this model vary based on policy decisions and community interventions for Ebola control. For example, the probability of remaining in the community
(here, undetected) throughout the course of the infection (_b__U_) increased in areas with insufficient hospital beds or health clinics. Furthermore, public health campaigns in countries
affected by the epidemic highlighting the importance of careful treatment of deceased individuals as well as allotment of resources to appropriately disinfect led to safer burial practices1.
In our model, this corresponds to increases in the probability that safe burials (1 − _f__j_) are provided. We explore the benefits of such controls in the Results section. BASIC
REPRODUCTIVE NUMBER IN NON-SPATIAL MODEL To find the basic reproductive number in the non-spatial model, we used the next generation matrix (see Appendix A for details) and obtain that This
quantity is straight forward to interpret biologically as _R_0 can be broken into contributions from each of the following: (i) transmission from the undetected class, divided by the exit
rate from _I__U_ of individuals who do not enter _I__H_ or _I__Q_ plus the exit rate of individuals who eventually enter _I__H_ or _I__Q_ (this term plays into the remaining components of
_R_0), (ii) transmission from the individuals who have left _I__U_ and enter the hospitalized class _I__H_ multiplied by the mean time spent in _I__U_ and (iii) transmission from individuals
in the _F_ class multiplied by the mean time spent in _F_ and by the fraction of individuals who eventually enter the _F_ class from any of the infectious classes. Each of the contributions
is reduced by the loss of individuals to natural mortality before infection can be transmitted. For an initial look at _R_0, we assumed that there is no control, i.e. all individuals remain
in the undetected class ( and ), then _R_0 simplifies even further to: which is the transmission rate from individuals in _I__U_ multiplied by the mean time spent in _I__U_, added to the
transmission rate from individuals who die and have a funeral multiplied by the mean time spent in _F_. We parameterize γ_U_ and _d__U_ from data20 which leaves the remaining unknowns are:
β_U_, β_F_ and α. The value of α does not have a large effect on _R_0, but the longer the time spent in the funeral class, the faster that _R_0 increases with β_F_ (Fig. 1A). For simplicity,
we choose α = 1 for the remainder of the paper. Transmission from the undetected class (β_U_) causes faster increases in _R_0 relative to transmission from funerals (β_F_), due to the short
amount of time in the _F_ class (Fig. 1A). MODEL WITH EXPLICIT SPACE To explicitly include space in our population, we mechanistically took into account movement of subpopulations, (as in
ref. 22), allowing the ability to incorporate populations of different sizes (see Appendix A for equations). Individuals are separated based on their status as home or visiting and
parameters are derived from the current local population for the individuals. Individuals leave their home population at rate ρ and return at rate τ. For consistency, there is movement
between patches of susceptible, exposed, infectious and recovered individuals but not of individuals in the funeral and effectively removed class. Infection can only occur when both
susceptible and infectious individuals are present in the same population. Several parameters can differ between populations depending on their respective intervention policies. For example,
case detection, hospitalization rates and quarantine status may vary. Therefore, we allow for differences in _b__U_, _b__H_ and _b__Q_. While we assume that the average time spent
infectious (1/γ_j_) is an intrinsic property of the disease, it is possible that the probability of surviving the disease varies (i.e. _j_). Burial practices may also differ between
populations so that, for example, different communities are more or less likely to hold a traditional burial which leads to differences in the value of _f__j_. BASIC REPRODUCTIVE NUMBER IN
SPATIAL MODEL Similar to the previous model without explicit space, we used the next generation matrix to compute the basic reproduction number numerically (see Appendix for details of _F_
and _V_ next generation matrices). Although we do not find an analytic form for the reproductive number due to the complexity of this model, we numerically determine _R_0 in our simulations.
Under simplifying assumptions, however, we recover an expression for _R_0 that resembles that for the non-spatial model. For example, excluding demographics (μ = 0) and intervention (_H_1 =
_H_2 = _Q_1 = _Q_2 = 0), assuming equal movement (ρ = τ) and equal population sizes and all other parameters equal between the two populations (i.e. β_U_1 = β_U_2, β_F_1 = β_F_2), the basic
reproduction number becomes: . Relaxing these assumptions such that the populations are no longer identical (i.e. β_U_1 ≠ β_U_2, β_F_1 ≠ β_F_2) but still excluding movement (τ = ρ = 0),
then the next generation matrix has two non-zero eigenvalues: the larger of which is the value for _R_0. Indeed, in the absence of movement (τ = ρ = 0) the two populations act independently
and the analysis of the non-spatial model is recovered for each subpopulation. Importantly, the value for _R_0 directly depends on both populations. This paints a more global picture of the
overall success of the Ebola epidemic. RESULTS We consider four strategies for disease intervention. Given that one population has optimally implemented an intervention strategy (hereafter
referred to as “population 1”), we determine implications for control of an epidemic when a second population (hereafter referred to as “population 2”) has sub-optimal management in the
presence of movement between populations. In the final strategy, we investigate two interventions employed at varying levels in the same population. When referring to a parameter specific to
a particular population, we will include a second index in the subscript to identify whether we are referring to population 1 or 2. The methods we consider are: * I _Hospitalization_. We
assume that population 1 successfully hospitalizes all infectious individuals as we as eliminated hospital transmission (, _b__H_1 ≈ 1, β_H_1 = 0). In contrast, population 2 has varying
levels of hospitalization (_b__H_) and transmission within hospitals (β_H_). * II _Hospitalization and safe burial practices_. Population 1 is as in method (I), with the addition that all
hospital deaths are treated with safe burials (_f__H_1 = 0). We assume that all cases are hospitalized in population 2 (, _b__H_2 ≈ 1), but it varies in its ability to eliminate transmission
within hospitals (β_H_2) as well as its use of safe burial practices following death after hospitalization (_f__H_2). * III _Quarantine and safe burial practices_. We assume that population
1 successfully quarantines all infected individuals (, _b__Q_1 ≈ 1) and that all deaths are treated with safe burials (_f__Q_1 = 0). In contrast, population 2 has varying levels of
quarantine (_b__Q_2) and usage of safe burial practices (_f__Q_2). * IV _Hospitalization and quarantine_. In this final scenario, we assume that population 1 has optimally implemented a
single intervention strategy but that population 2 uses a mixed strategy implementing both hospitalization and quarantine with varying degrees of success (_b__H_2 and _b__Q_2). To be
consistent with the 2013–2015 West African epidemic, we assume that _R_0 = 1.8520. However, the relative magnitudes of the transmission rate of individuals with undetected infections (β_U_)
and the transmission rate during traditional funerals (β_F_) is not well known. We therefore obtain a more global picture of the dynamics by varying the values of β_U_ and β_F_ while
maintaining the value _R_0 = 1.85 in the absence of intervention strategies. To assess when an the epidemic can be prevented for each of the above strategies, we then identify regions of
parameter space where the intervention strategy forces _R_0 < 1. HOSPITALIZATION Assuming that population 1 has achieved complete hospitalization without the possibility of further
transmission, we determine the plausibility of control when population 2 varies in its ability to detect and hospitalize infected individuals (_b__H_2) as well as the transmission rate in
the hospital (β_H_2). The relative balance of transmission for the hospitalized class and the funeral class will depend on the transmission rate from each of these classes, β_H_2 and β_F_2,
respectively. _R_0 < 1 can only be achieved if transmission from _I__H_ individuals is low and a substantial portion of the population enters the hospital (above and to the left of the
red curve corresponding to _R_0 = 1 in Fig. 2A inset). Over a range of combinations of β_U_ and β_F_, all corresponding to _R_0 = 1.85, we find when hospitalization is able to control the
epidemic, i.e. the contour corresponding to _R_0 = 1 (Fig. 2). Here, control is only possible if _I__U_ transmission is high relative to _F_ transmission, β_H_ is relatively small and _b__H_
is high (Fig. 2 upper left corner). In other words, assuming that transmission within hospitals is small, increasing hospitalization rates can have the most positive effect when the
majority of transmission is driven by undetected cases rather than unsafe burial practices. Interestingly, when there exists no movement between the subpopulations, the region where the
epidemic is controllable is smallest (Fig. 2A), as no benefit is accrued from movement of individuals from the region where hospitalization is ubiquitous. Thus, a larger proportion of the
population needs to enter the hospital for control to be achieved. As movement between the two population increases, the controllable region grows, particularly for increases in the hospital
transmission rate (β_H_2) (Fig. 2B,C). HOSPITALIZATION AND SAFE BURIAL PRACTICES The second method for control is similar to the first, but additionally assumes that all hospital deaths in
population 1 are treated with safe burials. Assuming that population 2 is now successful in hospitalizing all cases (, _b__H_2 ≈ 1), we vary its ability to reduce transmission within
hospitals (β_H_2) as well as the fraction of individuals having a traditional burial following death within a hospital (_f__H_2). We find there is a linear relationship between β_H_2 and
_f__H_2 (i.e. the contour corresponding to _R_0 = 1 is a line). When _f__H_2 and β_H_2 are both low, below and to the left of lines in Fig. 3, the epidemic is controllable as it is possible
to force _R_0 < 1 through hospitalizations. We find this line for various relative contributions of transmission from _I__U_ and _F_, with contributions from each denoted and ,
respectively (see details in Appendix A): For intermediate values of β_H_2 and _f__H_2 the ability to control the epidemics differs on whether β_H_2 is high and _f__H_2 is low, or vice
versa. When β_H_2 is high _f__H_2 is low, transmission is high in hospitals but few individuals who die have unsafe burials. Here, _R_0 can only be brought below one by reducing the number
of individuals who have unsafe burials. Control is more feasible if transmission at funerals is the main contributor to _R_0, rather than undetected cases (). In other words, even when _F_
transmission is high, reducing the number of individuals receiving an unsafe burial (low _f__H_2) can still bring _R_0 below one. Contrarily, when β_H_2 is low and _f__H_2 is high,
transmission is low in hospitals but most individuals receive a safe funeral. As transmission in the hospital class is reduced, more individuals who die following hospitalization can have an
unsafe burial and still force _R_0 below one. Control is more feasible if transmission from undetected cases is the primary contributor to _R_0, rather than cases originating from unsafe
burials (). Higher values of β_U_ correspond to minimal transmission during funerals and therefore, more individuals can have unsafe burials and _R_0 can still be forced to be below one.
Similar to the previous section, the amount of movement between the populations contributes to the ability for the total population to control the epidemic (Fig. 3B,C). The control available
in one subpopulation assists the lower level of control introduced in the other and has a greater impact as the movement between the two groups increases. QUARANTINE AND SAFE BURIAL
PRACTICES In the third method for control, we assume that population 1 quarantines all infected individuals and that all deaths following quarantine are treated with safe burials. We first
look at the effect of varying _b__Q_2 (fraction of individuals who enter the _Q_ class) and _f__Q_2 (fraction of individuals who have a traditional funeral following disease-induced death in
the _Q_ class). In this case, there is no need to vary the infectivity of individuals in _I__Q_ as they never contribute to infections, i.e. β_Q_ = 0. Here, if there is little transmission
from _F_ and high transmission from _I__U_ individuals, then the system is controllable as long as enough individuals enter the _Q_ class (Fig. 4A). However, if transmission during _F_ is at
an intermediate or high level, then it is not possible to control if there are a large number of quarantined individuals still having funerals (large _f__Q_). For intermediate values of
_b__Q_2 and _f__Q_2 the ability to control the epidemic depends on whether both _b__Q_2 and _f__Q_2 are high, or both are low. When _b__Q_2 is high, the proportion of individuals progressing
to funerals (_f__Q_2) can be relatively high, even above 50% and _R_0 can be brought below one. As there is no transmission in the _I__Q_ class, funerals resulting from this class are the
primary contribution to onward infections. Indeed, if _b__Q_2 is low, so most infected individuals remain undetected, regardless of the those safely buried following quarantine, the epidemic
is never controllable (Fig. 4). Contrarily, when _b__Q_2 is low, some individuals must receive a funeral for control to be achieved. As quarantine, by definition, limits transmission (β_Q_
= 0), when population 1 achieves safe burial practices (_f__Q_1 = 0), the ability to control is greatly affected by the amount of movement between populations (Fig. 4B,C). At lower levels of
movement, the transition of an epidemic from uncontrollable to controllable is more dependent on the proportion of the population entering quarantine (Fig. 4B). With a high level of
movement, even a minor reduction in the proportion of individuals receiving unsafe burials for a small proportion of the second population leads to control the epidemic (Fig. 4C). COMBINING
HOSPITALIZATION AND QUARANTINE In contrast to our examination of the use of only hospitalization or only quarantine, populations have the opportunity to apply hospitalization and quarantine
in combination, typically with some proportion of the population remaining undetected. When two populations are linked through movement of individuals, the use of both hospitalization and
quarantine leads to control of the epidemic more often than a single intervention alone (Figs 5 and 6). When one subpopulation chooses to apply a single intervention, a combination
intervention strategy in the other population can lead to control the epidemic (Fig. 5). When quarantine is chosen as the sole strategy, the total population will have a controllable
epidemic for a wider range of mixing since there is no onward transmission from the quarantined population (β_Q_ = 0) (Fig. 6). DISCUSSION Several countries in West Africa, in particular
Liberia, Sierra Leone and Guinea, experienced significant morbidity and mortality during the Ebola epidemic from 2013–2015. At the time of this epidemic there was no known vaccine or drug,
so effective disease control required coordinated efforts that include both standard strategies, such as hospitalization, as well as community efforts, such as safe burial practices. Not
only are such efforts difficult to implement in practice, but there is also added complexity with connectivity between populations that have different policies in place, as was the case in
these three countries. In this paper, we explore the role of movement between two theoretical populations in the overall success of practices designed to minimize the extent of Ebola
epidemics. We used the basic reproductive number, _R_0, as a metric for evaluating the overall success of a management strategy. In our simulations, we considered two populations with
varying management practices and then determined when control is possible as movement between spatial locations increases. We first assumed that one population maximized the potential
benefits of either (_I_) hospitalization, (_II_) both hospitalization and safe burial practices, or (_III_) quarantine and safe burial practices. In contrast, the other population
implemented varying levels of these management practices. We additionally considered one final scenario in which one populations used a combination of hospitalization and quarantine.
Importantly, in all scenarios we showed, a control strategy that is effective (_R_0 < 1) in a spatially isolated population may no longer be effective in the presence of connectivity with
another population that has weaker management policies in place. This results from deriving a more global value of _R_0 that accounts for interconnected populations that are simultaneously
experiencing Ebola outbreaks; in the presence of space, _R_0 depends on the dynamics within each spatial location as well as on interactions between them. Interestingly, the consequences of
connectivity is most substantial when movement rates are relatively small. Here, while local control in one population may be independently effective, the more global picture demonstrates
that the epidemic will continue to progress. In contrast, Ebola management is possible under a wider range of implementation strategies for the second population as movement rates increase.
This is because the total population becomes more homogeneous and the second population can benefit directly from the first population’s policies. In general, the overall success of each
management scenario depends on the associated levels of control in the second population. In our model quarantine is more effective than hospitalization because of the differences in
transmission rates from individuals in the hospitalized as compared to the quarantine class; while transmission is lower in hospitals as compared to undetected individuals, transmission is
eliminated from individuals in quarantine. In practice, however, quarantine may not completely abrogate transmission as both infected and uninfected individuals may be forced together. While
hospitalization is necessary to minimize the morbidity and mortality associated with infected patients, hospitals must take measures to minimize the transmission from individuals infected
with Ebola to health care workers and other patients in the hospital. Our results highlight the direct benefit of safe burial practices on the controllability of Ebola epidemics. This is
most evident in Fig. 5; including safe burial practices in addition to a combination of hospitalization and quarantine greatly increases the range of successful management implementations.
In fact, when all Ebola-related deaths are provided traditional burials, Ebola epidemics are almost never controllable. Analysis of previous epidemics has also indicated the importance of
transmission during traditional funeral practices23. As a result, proper safe burial has become an important tenant of Ebola control4,5,6. We evaluated the potential success of several
controls designed to combat Ebola when policies differ between two distinct populations. Our findings indicate that the effectiveness of policies for Ebola management can very dramatically
depending on how connected a given location is to neighboring regions. The potential imbalance of resources could impact even the populations receiving the bulk of resources, if the
populations are interconnected. As the worldwide travel and porous borders are common, no population can consider itself in isolation. More generally, this study highlights the critical
importance of considering spatial structure when evaluating disease management strategies. ADDITIONAL INFORMATION HOW TO CITE THIS ARTICLE: Blackwood, J. C. and Childs, L. M. The role of
interconnectivity in control of an Ebola epidemic. _Sci. Rep_. 6, 29262; doi: 10.1038/srep29262 (2016). REFERENCES * Brainard, J., Hooper, L., Pond, K., Edmunds, K. & Hunter, P. R. Risk
factors for transmission of ebola or marburg virus disease: a systematic review and meta-analysis. _International journal of epidemiology_ dyv307 (2015). * WHO. Ebola situation report - 20
january 2016. http://apps.who.int/ebola/current-situation/ebola-situation-report-2-march-2016 Accessed: 4 March 2016 (2016). * Gatherer, D. The 2014 ebola virus disease outbreak in west
africa. Journal of General Virology 95, 1619–1624 (2014). Article CAS Google Scholar * WHO. Liberia operational plan for accelerated response to re-occurence of ebola epidemic.
http://www.who.int/csr/disease/ebola/evd-outbreak-response-plan-west-africa-2014-annex3.pdf?ua=1 Accessed: 4 March 2016 (2015). * WHO. Planned response to the ebola virus disease epidemic in
guinea. http://www.who.int/csr/disease/ebola/evd-outbreak-response-plan-west-africa-2014-annex2.pdf?ua=1 Accessed: 4 March 2016 (2015). * WHO. Sierra leone accelerated ebola virus disease
outbreak response plan. http://www.who.int/csr/disease/ebola/evd-outbreak-response-plan-west-africa-2014-annex4.pdf?ua=1 Accessed: 4 March 2016 (2015). * Chretien, J.-P., Riley, S. &
George, D. B. Mathematical modeling of the west africa ebola epidemic. Elife e09186 (2015). * Chowell, G., Hengartner, N. W., Castillo-Chavez, C., Fenimore, P. W. & Hyman, J. The basic
reproductive number of ebola and the effects of public health measures: the cases of congo and uganda. Journal of Theoretical Biology 229, 119–126 (2004). Article CAS MathSciNet Google
Scholar * Kucharski, A. J. et al. Measuring the impact of ebola control measures in sierra leone. Proceedings of the National Academy of Sciences 112, 14366–14371 (2015). Article CAS ADS
Google Scholar * Legrand, J., Grais, R. F., Boelle, P.-Y., Valleron, A.-J. & Flahault, A. Understanding the dynamics of ebola epidemics. Epidemiology and infection 135, 610–621
(2007). Article CAS Google Scholar * Lewnard, J. A. et al. Dynamics and control of ebola virus transmission in montserrado, liberia: a mathematical modelling analysis. The Lancet
Infectious Diseases 14, 1189–1195 (2014). Article Google Scholar * Merler, S. et al. Spatiotemporal spread of the 2014 outbreak of ebola virus disease in liberia and the effectiveness of
non-pharmaceutical interventions: a computational modelling analysis. The Lancet Infectious Diseases 15, 204–211 (2015). Article Google Scholar * Pandey, A. et al. Strategies for
containing ebola in west africa. Science 346, 991–995 URL http://www.sciencemag.org/content/346/6212/991.abstract (2014). Article CAS ADS Google Scholar * Shen, M., Xiao, Y. & Rong,
L. Modeling the effect of comprehensive interventions on ebola virus transmission. Scientific reports 5 (2015). * Weitz, J. S. & Dushoff, J. Modeling post-death transmission of ebola:
Challenges for inference and opportunities for control. Scientific Reports 5 (2015). * Brown, G. D., Oleson, J. J. & Porter, A. T. An empirically adjusted approach to reproductive number
estimation for stochastic compartmental models: A case study of two ebola outbreaks. Biometrics (2015). * Gomes, M. F. et al. Assessing the international spreading risk associated with the
2014 west african ebola outbreak. PLOS Currents Outbreaks 1 (2014). * Kiskowski, M. & Chowell, G. Modeling household and community transmission of ebola virus disease: epidemic growth,
spatial dynamics and insights for epidemic control. Virulence 1–11 (2015). * Yang, W. et al. Transmission network of the 2014–2015 ebola epidemic in sierra leone. Journal of The Royal
Society Interface 12, 20150536 (2015). Article Google Scholar * Van Kerkhove, M. D., Bento, A. I., Mills, H. L., Ferguson, N. M. & Donnelly, C. A. A review of epidemiological
parameters from ebola outbreaks to inform early public health decision-making. Scientific Data 2 (2015). * Team, W. E. R. et al. Ebola virus disease in west africa in the first 9 months of
the epidemic and forward projections. N Engl J Med 371, 1481–95 (2014). Article Google Scholar * Keeling, M. J. & Rohani, P. Estimating spatial coupling in epidemiological systems: a
mechanistic approach. Ecology Letters 5, 20–29 (2002). Article Google Scholar * Dowell, S. F. et al. Transmission of ebola hemorrhagic fever: a study of risk factors in family members,
kikwit, democratic republic of the congo, 1995. Journal of Infectious Diseases 179, S87–S91 (1999). Article Google Scholar * WHO. Life expectancy by country.
http://apps.who.int/gho/data/node.main.688 Accessed: 4 March 2016 (2016). Download references ACKNOWLEDGEMENTS We thank two anonymous reviewers for their helpful feedback on earlier versions
of this manuscript. LMC was supported by Award Number U54GM088558 from the National Institute Of General Medical Sciences. The content is solely the responsibility of the authors and does
not necessarily represent the official views of the National Institute Of General Medical Sciences or the National Institutes of Health. AUTHOR INFORMATION Author notes * Blackwood J. C. and
Childs L. M. contributed equally to this work. AUTHORS AND AFFILIATIONS * Department of Mathematics and Statistics Williams College, Williamstown, 01267, MA, USA J. C. Blackwood & L. M.
Childs * Center for Communicable Disease Dynamics Harvard T.H. Chan School of Public Health, Boston, 02115, MA, USA L. M. Childs Authors * J. C. Blackwood View author publications You can
also search for this author inPubMed Google Scholar * L. M. Childs View author publications You can also search for this author inPubMed Google Scholar CONTRIBUTIONS J.C.B. and L.M.C.
contributed equally to this work. Both authors conceptualized the study, developed the mathematical models, analyzed the models, produced the figures and wrote the manuscript. ETHICS
DECLARATIONS COMPETING INTERESTS The authors declare no competing financial interests. ELECTRONIC SUPPLEMENTARY MATERIAL SUPPLEMENTARY INFORMATION RIGHTS AND PERMISSIONS This work is
licensed under a Creative Commons Attribution 4.0 International License. The images or other third party material in this article are included in the article’s Creative Commons license,
unless indicated otherwise in the credit line; if the material is not included under the Creative Commons license, users will need to obtain permission from the license holder to reproduce
the material. To view a copy of this license, visit http://creativecommons.org/licenses/by/4.0/ Reprints and permissions ABOUT THIS ARTICLE CITE THIS ARTICLE Blackwood, J., Childs, L. The
role of interconnectivity in control of an Ebola epidemic. _Sci Rep_ 6, 29262 (2016). https://doi.org/10.1038/srep29262 Download citation * Received: 05 May 2016 * Accepted: 13 June 2016 *
Published: 07 July 2016 * DOI: https://doi.org/10.1038/srep29262 SHARE THIS ARTICLE Anyone you share the following link with will be able to read this content: Get shareable link Sorry, a
shareable link is not currently available for this article. Copy to clipboard Provided by the Springer Nature SharedIt content-sharing initiative