Visual odometry with neuromorphic resonator networks
- Select a language for the TTS:
- UK English Female
- UK English Male
- US English Female
- US English Male
- Australian Female
- Australian Male
- Language selected: (auto detect) - EN
Play all audios:
Visual odometry (VO) is a method used to estimate self-motion of a mobile robot using visual sensors. Unlike odometry based on integrating differential measurements that can accumulate
errors, such as inertial sensors or wheel encoders, VO is not compromised by drift. However, image-based VO is computationally demanding, limiting its application in use cases with
low-latency, low-memory and low-energy requirements. Neuromorphic hardware offers low-power solutions to many vision and artificial intelligence problems, but designing such solutions is
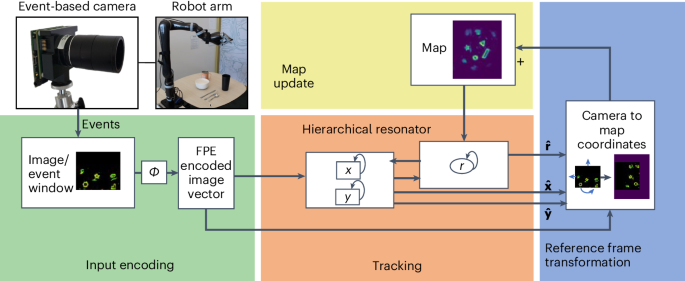
complicated and often has to be assembled from scratch. Here we propose the use of vector symbolic architecture (VSA) as an abstraction layer to design algorithms compatible with
neuromorphic hardware. Building from a VSA model for scene analysis, described in our companion paper, we present a modular neuromorphic algorithm that achieves state-of-the-art performance
on two-dimensional VO tasks. Specifically, the proposed algorithm stores and updates a working memory of the presented visual environment. Based on this working memory, a resonator network
estimates the changing location and orientation of the camera. We experimentally validate the neuromorphic VSA-based approach to VO with two benchmarks: one based on an event-camera dataset
and the other in a dynamic scene with a robotic task.
The event-based shapes dataset41 is publicly available at https://rpg.ifi.uzh.ch/davis_data.html. The robotic arm data generated and analysed during the current study are available via Code
Ocean at https://doi.org/10.24433/CO.6568112.v1 (ref. 73).
The source code to demonstrate the hierarchical resonator on the VO task73 is available via Code Ocean at https://doi.org/10.24433/CO.6568112.v1.
A.R. thanks his former students C. Nauer, A. Bojic, R. P. Belizón, M. Graetz and A. Collins for helpful discussions. Y.S. and A.R. disclose support for the research of this work from the
Swiss National Science Foundation (SNSF) (ELMA PZOOP2 168183). A.R. discloses support for the research of this work from Accenture Labs, the University of Zurich postdoc grant (FK-21-136)
and the VolkswagenStiftung (CLAM 9C854). F.T.S. discloses support for the research of this work from NIH (1R01EB026955-01).
Institute of Neuroinformatics, University of Zurich and ETH Zurich, Zürich, Switzerland
Neuromorphic Computing Lab, Intel Labs, Santa Clara, CA, USA
Redwood Center for Theoretical Neuroscience, UC Berkeley, Berkeley, CA, USA
ZHAW Zurich University of Applied Sciences, Wädenswil, Switzerland
A.R., L.S., A.D., G.I., E.P.F., F.T.S. and Y.S. contributed to writing and editing of the paper. Y.S. and L.S. conceptualized the project in the robotic space. A.R., E.P.F. and F.T.S.
conceptualized the project in the algorithmic space. A.R. developed the VO network model and performed and analysed the network simulations. L.S. performed the robotic arm experiments.
Nature Machine Intelligence thanks Yiannis Aloimonos and the other, anonymous, reviewer(s) for their contribution to the peer review of this work.
Publisher’s note Springer Nature remains neutral with regard to jurisdictional claims in published maps and institutional affiliations.
The video visualizes the tracking of the location and rotation of an event-based camera mounted on a robotic arm and supplements Fig. 4d. The input to the network (pre-processed events from
an event-based camera) is shown in green, and the transformed readout from the map vector in red. The yellow pixels indicate overlap between the map and camera view. The map is transformed
into the input reference frame using the HRN’s camera pose estimate (output). The bowl is removed around second 25 and subsequently fades from the map. The video is illustrative and does not
contain frames for all iterations of the network.
The video visualizes the dynamics of the map and supplements Fig. 4d. Each frame shows the readout from the map vector, that is, it visualizes the similarity of each pixel’s codebook vector
with the map vector. Higher similarity is shown in brighter colours. The bowl is removed around second 25 and subsequently fades from the map. The video is illustrative and does not contain
frames for all iterations of the network.
Springer Nature or its licensor (e.g. a society or other partner) holds exclusive rights to this article under a publishing agreement with the author(s) or other rightsholder(s); author
self-archiving of the accepted manuscript version of this article is solely governed by the terms of such publishing agreement and applicable law.
Anyone you share the following link with will be able to read this content: