Kidney volume measurement and predictive modeling in children aged 0–18 years using a computer-assisted surgery system
- Select a language for the TTS:
- UK English Female
- UK English Male
- US English Female
- US English Male
- Australian Female
- Australian Male
- Language selected: (auto detect) - EN
Play all audios:
ABSTRACT This study aimed to measure the normal renal volume in children and adolescents aged 0–18 years from the eastern coastal region of China using the computer-assisted surgery (CAS)
system. Accurate measurement of kidney volume is important as a marker for follow-up in patients with congenital anomalies. We established reference ranges for renal volume based on age,
height, and weight, and developed predictive models using commonly available clinical data. A total of 803 children and adolescents participated, with clinical data including age, gender,
height, weight, body mass index (BMI) and body surface area (BSA) collected. The Hisense CAS system was employed to perform 3D reconstructions of CT images, allowing precise measurement of
left and right kidney volumes. Statistical analysis revealed a significant difference in size between the left and right kidneys (_P_ < 0.01), with the left kidney being larger in 79.08%
of cases. Age, height, weight, BMI, and BSA were all significantly correlated with kidney volume, with BSA showing the strongest correlation. We developed predictive formulas based on height
and weight with good accuracy (R² = 0.896 for left kidney and R² = 0.891 for right kidney). These findings provide reference values for renal volume and offer useful tools for early
detection and monitoring of renal abnormalities in the pediatric population. SIMILAR CONTENT BEING VIEWED BY OTHERS IMPROVED PREDICTIONS OF TOTAL KIDNEY VOLUME GROWTH RATE IN ADPKD USING
TWO-PARAMETER LEAST SQUARES FITTING Article Open access 14 June 2024 KIDNEY VOLUME-TO-BIRTH WEIGHT RATIO AS AN ESTIMATE OF NEPHRON ENDOWMENT IN EXTREMELY LOW BIRTH WEIGHT PRETERM INFANTS
Article Open access 18 June 2024 THE CORRELATION BETWEEN GFR AND UNIT RENAL VOLUME IN INFANTS WITH HYDRONEPHROSIS MEASURED BY TWO IMAGING METHODS Article Open access 09 November 2023
INTRODUCTION Renal volume is a critical clinical parameter, with many kidney diseases and treatments associated with changes in kidney size. For instance, conditions such as congenital
kidney abnormalities, polycystic kidney disease, and post-nephrectomy follow-up all involve renal volume as a key factor1,2. Additionally, Smaller kidney volumes and higher blood pressure
are associated with increased albuminuria, further supporting the connection between kidney volume and long-term kidney health. This highlights the need to measure renal volume in order to
evaluate kidney function in children and detect kidney disease early, which is essential for developing preventive strategies3,4,5. While kidney volume in children is known to be influenced
by race, there is limited reference data for normal renal volume in Chinese children across various age groups3. Clinically, kidney morphology is still commonly described using measurements
of kidney length, width, and height, which require complex calculations based on assumptions about kidney shape6,7,8. With advancements in three-dimensional(3D) imaging technology, there has
been growing interest in accurately measuring kidney volume and virtually reconstructing kidney morphology. However, the accuracy of ultrasound-based kidney volume measurements remains
debated9. The computer-assisted surgery (CAS) system can perform 3D reconstructions of enhanced CT images in pediatric patients and automatically provide precise renal volume measurements.
This study aims to use the CAS system to measure normal kidney volume parameters in children, establish reference ranges for renal volume across different age, height, and weight, and
develop predictive models using commonly available clinical data, such as height and weight. MATERIALS AND METHODS STUDY DESIGN AND PATIENTS In this retrospective study, we collected data
from 803 pediatric patients aged 0–18 years who were treated between December 2012 and July 2022 for hepatic or pancreatic diseases, such as hepatoblastoma, or other non-renal conditions
that did not involve the kidneys. The cohort consisted of 438 females and 365 males. All patients underwent dynamic contrast-enhanced abdominal CT scans, and their imaging data were
reconstructed in 3D using the Hisense CAS system. Inclusion criteria: (1) Exclusion of premature infants and children who are small for their age; (2) No history of renal disease or other
major conditions affecting kidney volume (e.g., renal failure, renal tumors); (3) Absence of urinary tract malformations, acute or chronic urinary tract infections, hereditary metabolic
disorders, endocrine disorders, or congenital heart disease, which could potentially impact renal growth and development; (4) No evidence of kidney deformation due to intra-abdominal tumors
(e.g., intra-abdominal cysts, teratomas); (5) Availability of clear contrast-enhanced CT images along with complete clinical data, including gender, height, weight, body surface area, and
body mass index; (6) Informed consent was obtained from the children and their legal guardians, who voluntarily agreed to participate in the study. Basic clinical information, including age
(months/years), height (cm), weight (kg), and kidney volume (cm3), was collected. The study was approved by the Ethics Committee of the Affiliated Hospital of Qingdao University (Approval
No. QYFY WZLL 29043). All experiments were performed in accordance with relevant guidelines and regulations. EQUIPMENT AND MATERIALS ABDOMINAL CONTRAST-ENHANCED CT SCANNING EQUIPMENT The
following CT scanners were utilized: GE DISCOVERY CT750HD 64-slice spiral CT (USA); GE BRIGHTSPEED ELITE 16-slice CT (USA); Philips MX4000 dual-slice spiral CT (Netherlands); and Siemens
SOMATOM Sensation Cardiac 64-slice CT (Germany). HISENSE COMPUTER ASSISTED SURGERY SYSTEM (HISENSE CAS) Model: JI-GEMI-MS4, System Version: CAS V4.02. The Hisense CAS, a computer-assisted
surgery system, was developed in collaboration between the Affiliated Hospital of Qingdao University and Hisense Medical Group, under the support of China’s National “Twelfth Five-Year”
Science and Technology Project. NON-IONIC CONTRAST AGENT Iopromide injection (100 mL∶35 g I) (Beijing Beilu Pharmaceutical Co., Ltd.), with the National Drug Standard Number: H20053800.
FORMULAS FOR BODY SURFACE AREA (BSA) AND BODY MASS INDEX (BMI) BSA (m²) = 0.024265 * Weight (kg) 0.5378 *Height (cm) 0.3964(Haycock formula)10; BMI (kg/m²) = Weight (kg) / Height² (m)11.
FORMULAS FOR BSA-ADJUSTED KIDNEY VOLUME $$\begin{aligned} & {\text{BSA}} - {\text{Adjusted Left Kidney Volume }}\left( {{\text{BSA}}\_{\text{adjusted}}\_{\text{LK}}} \right){\text{
}}\left( {{\text{cm}}^{{\text{3}}} /{\text{m}}^{{\text{2}}} } \right) = {\text{ Left Kidney Volume }}\left( {{\text{cm}}^{{\text{2}}} } \right)/{\text{BSA }}\left( {{\text{m}}^{{\text{2}}} }
\right) \\ & {\text{BSA}} - {\text{Adjusted Right Kidney Volume }}\left( {{\text{BSA}}\_{\text{adjusted}}\_{\text{RK}}} \right){\text{ }}\left( {{\text{cm}}^{{\text{3}}}
/{\text{m}}^{{\text{2}}} } \right) = {\text{ Right Kidney Volume }}\left( {{\text{cm}}^{{\text{3}}} } \right)/{\text{BSA }}\left( {{\text{m}}^{{\text{2}}} } \right) \\ & {\text{BSA}} -
{\text{Adjusted Total Kidney Volume }}\left( {{\text{BSA}}\_{\text{adjusted}}\_{\text{TK}}} \right){\text{ }}\left( {{\text{cm}}^{{\text{3}}} /{\text{m}}^{{\text{2}}} } \right) = {\text{
Total Kidney Volume }}\left( {{\text{cm}}^{{\text{3}}} } \right)/{\text{BSA }}\left( {{\text{m}}^{{\text{2}}} } \right) \\ \end{aligned}$$ These formulas normalize kidney volumes to body
surface area, providing a standardized measure to account for variations in body size among individuals. RESEARCH METHODS ABDOMINAL DYNAMIC CONTRAST-ENHANCED CT EXAMINATION Before the
examination, patients were instructed to fast for 4–6 h, and an intravenous line was established for the injection of iodinated contrast medium (Iohexol). For uncooperative children, 0.5
mg/kg of chloral hydrate was administered via rectal enema. The child was positioned supine on the CT examination table, ensuring the body was straight, with the head resting on a headrest
and both hands raised above the head to maintain stillness. The operator positioned the CT table over the upper abdomen, scanning from the diaphragm to the umbilicus, with the scan direction
from head to foot. The arterial phase delay was set to 25 s, and the portal venous phase delay was set to 50 s. Finally, the image data were uploaded and stored in the workstation in DICOM
format. 3D RECONSTRUCTION OF THE KIDNEY USING HISENSE CAS * (1) The DICOM files of the thin-slice CT scans were imported into the Hisense CAS system for processing. * (2) Window width and
level were adjusted, and kidney edges were precisely segmented in the equilibrium phase using a region-growing segmentation algorithm. The segmentation results were verified by overlaying a
transparent mask on the original image data, with interactive tools for local adjustments. Accurate kidney volume measurements were then calculated by combining the segmentation results with
imaging scan parameters, such as pixel spacing and slice thickness. The results, along with an interactive 3D reconstruction image with full rotational capability, were displayed in the
window. * (3) To ensure the accuracy of the segmentation, the segmented areas of interest on the CT images were compared with the corresponding areas on the 3D kidney model. Each case was
reviewed and verified by at least two experienced pediatric surgeons with over five years of experience and one radiologist with over ten years of experience. The inter-observer reliability
was maintained through consistent calibration and regular training for the medical staff involved in the review process. STATISTICAL ANALYSIS METHODS Data analysis was performed using SPSS
version 29.0. The normality of continuous variables was first assessed with the Shapiro-Wilk test. Normally distributed data were expressed as mean ± standard deviation (x̄±s) and compared
between groups using the t-test. Non-normally distributed data were presented as the median (range) [M(P25, P75)] and compared between groups using the Mann–Whitney U test. Categorical data
were expressed as percentages (%). For the reference ranges of renal volume in different groups, if the data were normally distributed, the reference range was estimated using “mean ± 1.96 ×
standard deviation”; for non-normally distributed data, the reference range was determined using percentiles (e.g., 5th and 95th percentiles). The correlation between renal volume and age,
height, weight, and gender was analyzed using Pearson correlation analysis. Multiple linear regression was employed to obtain correlation coefficients and regression equations. All analyses
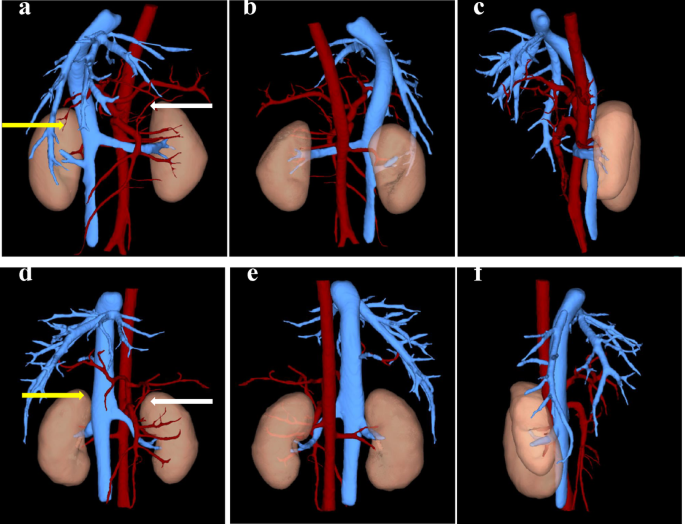
were considered statistically significant at _P_ < 0.05. RESULTS CLINICAL BASELINE DATA AND 3D RECONSTRUCTION OUTCOMES A total of 803 children were included in the study, and their
clinical data, including age, gender, height, weight, body surface area (BSA), and body mass index (BMI), were collected, as detailed in Table 1. Using the Hisense CAS system, 3D
reconstruction of the CT images was performed to obtain the bilateral kidney volumes for each child. The reconstructed images are illustrated in Fig. 1. COMPARISON OF LEFT AND RIGHT KIDNEY
VOLUMES Paired t-tests were conducted to compare the volumes of the left and right kidneys in each child. The results revealed a statistically significant difference between the two sides
(_P_ < 0.01). Specifically, in 635 cases (79.08%), the left kidney was larger than the right. The detailed statistics are presented in Supplementary Table S1. CORRELATION ANALYSIS BETWEEN
KIDNEY VOLUME AND CLINICAL BASELINE CHARACTERISTICS CORRELATION OF AGE, HEIGHT, WEIGHT, BSA, AND BMI WITH KIDNEY VOLUME We analyzed the correlations between age, height, weight, BSA, and
BMI with the volumes of the left, right, and total kidneys. The results are summarized in Table 2 (descriptive statistics) and Table 3 (correlation analysis). The analysis showed that BSA
had the highest correlation with kidney volume, while BMI had the lowest. DIFFERENCES IN KIDNEY VOLUME BETWEEN GENDERS WITHIN THE SAME AGE GROUP We compared kidney volumes between boys and
girls within the same age group. No statistically significant differences were observed between the genders across all age groups (_P_ > 0.05). Generally, boys tended to have slightly
larger kidney volumes than girls, as shown in Supplementary Table S2. REFERENCE RANGES FOR KIDNEY VOLUME BASED ON DIFFERENT GROUPINGS Given that age, height, and weight are clinically
accessible and straightforward metrics, we established reference ranges for kidney volume by grouping based on these three indicators, as shown in Supplementary Table S3. To standardize
kidney volume measurements, we adjusted for body size by calculating the BSA-adjusted kidney volumes for the left (BSA_adjusted_LK), right (BSA_adjusted_RK), and total kidneys
(BSA_adjusted_TK). These adjustments were done by dividing the measured kidney volumes by the body surface area (BSA), which accounts for variations in body size across individuals. The
standardized kidney volumes were calculated and grouped by age, with the mean and standard deviation for each group provided in Supplementary Table S4. DEVELOPMENT OF A PEDIATRIC KIDNEY
VOLUME PREDICTION MODEL Given the strong correlation between kidney volume and the factors of age, height, and weight, as identified in “Correlation of age, height, weight, BSA, and BMI with
kidney volume” section, and considering that these parameters are easily obtainable in clinical practice, we established a pediatric kidney volume prediction model incorporating these three
variables. MULTIPLE LINEAR REGRESSION MODEL Initially, scatter plots were generated to visualize the relationships between age, height, and weight with kidney volumes for both kidneys (Fig.
2). The plots indicate a clear positive linear correlation between these variables and kidney volume. Based on these observations, a stepwise multiple linear regression analysis was
conducted with kidney volume as the dependent variable and age, height, and weight as independent variables. Three models were generated, as detailed in in Supplementary Table S5. However,
high collinearity (VIF > 10) was observed when all three variables were included, prompting us to exclude age, the variable with the highest VIF, from the final models. The resulting
predictive models for left and right kidney volumes are as follows: Left Kidney Volume: Y = − 22.427 + 0.636 × Height + 1.200 × Weight (cm2) (R2 = 0.896; _P_ < 0.01);Right Kidney Volume:
Y = − 19.522 + 0.585 × Height + 1.149 × Weight (cm2) (R2 = 0.891; _P_ < 0.01). MODEL VALIDATION To assess the applicability and accuracy of the regression models, we visualized the
results through residual plots (Fig. 3a–b), prediction interval plots (Fig. 3c–d), and Bland-Altman plots (Fig. 3e–f). The residual plots show a random distribution of scatter points around
the red dashed line, indicating that the linear regression models are appropriate for the data. The prediction interval plots demonstrate that most actual values fall within the confidence
intervals, and the predicted value curves closely follow the actual values, suggesting high model reliability. The Bland-Altman plots reveal that most points fall within the limits of
agreement, with an average difference close to zero, indicating good consistency between the predicted and actual values. DISCUSSION This study aimed to analyze kidney volumes and clinical
baseline data in children and adolescents aged 0–18 years from the eastern coastal region of China. We established reference values for kidney volumes in this population, categorized by age,
height, and weight. We also developed predictive formulas based on commonly available clinical parameters, which have practical value for clinical use. Kidney volume is closely associated
with various renal conditions, such as congenital renal anomalies, polycystic kidney disease, and urinary tract infections12. Accurate kidney volume measurements help clinicians detect these
conditions early, improving treatment and prognosis. Many studies have calculated kidney volume using ellipsoid or other geometric formulas, which rely on kidney length, width, and
anteroposterior diameter measurements3,13. However, these methods may not detect subtle changes in kidney volume and may suffer from accuracy and reproducibility issues. While 3D ultrasound
can provide volume measurements, its results can be affected by operator subjectivity or patient positioning, especially in younger children prone to movement and may introduce artifacts.
Additionally, 3D ultrasound measurements tend to underestimate actual kidney volume, which is consistent with our findings and other studies1,14. In contrast, CT and MRI offer greater
accuracy and consistency in kidney volume measurement. Although MRI provides high-resolution imaging, it requires longer scan times and higher patient compliance. CT, however, offers high
spatial resolution, reducing measurement errors and providing more precise kidney boundary delineation. Additionally, it is faster, making it more suitable for pediatric patients. In this
study, we used the CAS system to process CT imaging data, which considers imaging parameters like pixel spacing and slice thickness. The system performs 3D reconstructions from axial,
sagittal, and coronal views, allowing for accurate kidney volume measurements. Additionally, the CAS system can provide detailed information on the surrounding anatomical structures and the
relationships with adjacent organs. It has been demonstrated to be compatible with various CT machines and DICOM files of differing slice thicknesses, further proving its accuracy and
robustness in kidney volume measurement15,16. The differences in kidney volume between genders are still debated. Most studies show no significant differences in kidney volume between boys
and girls1,13,17. Our study supports this finding, showing no significant difference across age groups. This suggests that renal development in childhood may be highly homogeneous regardless
of gender. However, some studies report slightly smaller kidney volumes in girls, likely due to lower average body weight and surface area18,19. Our study also observed a significant
difference between the left and right kidney volumes, consistent with previous literature that the left kidney is typically larger20. In our cohort, 79.08% of children had a larger left
kidney, likely due to anatomical factors, as the right kidney’s growth is constrained by the liver. Similar findings were reported by Shi et al., with a significant difference in average
kidney volume between the left and right kidneys1. Interestingly, Schmidt et al. documented that the right kidney volume was slightly but significantly larger in both boys and girls (_p_
< 0.001 and _p_ < 0.01, respectively), making it the only study to find a larger right kidney21. These discrepancies suggest that kidney volume differences between the left and right
kidneys may be influenced by genetic, developmental, and environmental factors. Kidney volume correlates strongly with age, height, weight, and BSA, reflecting the unique characteristics of
pediatric growth. In our study, BSA showed the strongest correlation with kidney volume (left kidney _r_ = 0.946, right kidney _r_ = 0.943), followed by weight (left kidney _r_ = 0.925,
right kidney _r_ = 0.923). This high correlation can be explained by BSA being a more comprehensive measure of the body’s overall size and metabolic capacity, as it accounts for both height
and weight, factors that influence kidney development. BMI, on the other hand, showed the weakest correlation with kidney volume (left kidney _r_ = 0.519, right kidney _r_ = 0.519). This is
likely because BMI, while reflecting body mass, does not directly account for other aspects of body composition, such as muscle mass and fat distribution, which could more strongly affect
kidney size. These findings are consistent with the results from Obrycki et al. and Dinkel et al.12,22. However, Shi et al. reported that kidney volume correlates most strongly with age1.
Our study is the first in China to provide reference ranges for pediatric kidney volume based on height and weight. We also found that kidney volumes across all age groups were larger than
those reported in studies using 3D ultrasound, likely due to differences in measurement methods1,14. By dividing the measured kidney volume by BSA, we accounted for body size variations
among individuals. We grouped the data by age and observed that kidney volume tends to increase with age, with the highest values seen in the 16–18 year age group, reflecting the final
stages of renal development. Considering the body surface area of pediatric patients, these reference ranges can be used to assess kidney volume in clinical settings. Changes in kidney
volume often precede significant alterations in renal function. We developed simple regression equations for clinical use, based on height and weight as easily accessible data. The equations
are as follows: $$\begin{aligned} & {\text{Left kidney volume}}:{\text{ Y}} = - {\text{22}}.{\text{427}} + 0.{\text{636}} \times {\text{Height}} + {\text{1}}.{\text{2}}00 \times
{\text{Weight }}\left( {{\text{cm}}^{{\text{3}}} } \right){\text{ }}\left( {{\text{R}}^{{\text{2}}} {\text{ }} = {\text{ }}0.{\text{896}};{\text{ P }} < {\text{ }}0.0{\text{1}}} \right)
\\ & {\text{Right kidney volume}}:{\text{ Y}} = - {\text{19}}.{\text{522}} + 0.{\text{585}} \times {\text{Height}} + {\text{1}}.{\text{149}} \times {\text{Weight }}\left(
{{\text{cm}}^{{\text{3}}} } \right){\text{ }}\left( {{\text{R}}^{{\text{2}}} {\text{ }} = {\text{ }}0.{\text{891}};{\text{ P }} < {\text{ }}0.0{\text{1}}} \right) \\ \end{aligned}$$
Residual plots and other visualizations indicate that these equations offer a high degree of accuracy and general applicability. Previous studies, such as those by Otiv et al., Fujita et
al., and Duminda et al., focused on predicting kidney length using ultrasound, but these models are limited in assessing changes in kidney morphology and size comprehensively, as they do not
account for kidney volume23,24,25. Additionally, Shi et al. used 3D ultrasound to measure kidney volume and developed prediction formulas, but their measurements tended to underestimate
actual kidney volume1,14. In contrast, our models based on height and weight provide a more accurate and comprehensive prediction of kidney volume. However, this study has several
limitations. First, our study was limited to children and adolescents from the eastern coastal region of China, which may restrict the generalizability of our findings to other populations.
While the results provide important reference values for the Chinese population, further studies are needed to assess their applicability to children from other regions and ethnic groups.
Future research should include a larger sample size, incorporating children from diverse backgrounds to validate and adjust the reference values and predictive models for kidney volume.
Additionally, this study did not collect information on factors such as kidney length and kidney function data, which will require prospective research. We are planning to conduct research
on this aspect. Another limitation is the potential radiation risk posed to pediatric patients by the CT scans used in this study. Future research should consider including these variables
and explore alternative, lower-radiation imaging methods, such as low-dose CT or MRI, to refine our models and predictive formulas. CONCLUSION In summary, this study provides reference
values for kidney volumes in children and adolescents aged 0–18 years from the eastern coastal region of China and develops predictive formulas based on commonly available clinical data.
These findings have significant clinical relevance as they can aid in early detection of renal developmental abnormalities, guide treatment decisions, and improve long-term renal health
monitoring following nephrectomy. By applying these reference ranges and predictive models, clinicians can better assess kidney growth patterns and intervene early in cases of abnormal
development. Future studies should expand the sample size and include more influencing factors to enhance the reliability and clinical applicability of the results. DATA AVAILABILITY The
datasets generated during and analyzed during the current study are available from the corresponding author on reasonable request. REFERENCES * Shi, B., Yang, Y., Li, S. X., Ju, H. &
Ren, W. D. Ultrasonographic renal volume in Chinese children: Results of 1683 cases. _J. Pediatr. Surg._ 50(11), 1914–1918 (2015). Article PubMed Google Scholar * Burgmaier, K. et al.
Early childhood height-adjusted total kidney volume as a risk marker of kidney survival in ARPKD. _Sci. Rep._ 11(1), 21677 (2021). Article ADS CAS PubMed PubMed Central Google Scholar
* Bakker, H. et al. Kidney size and function in a multi-ethnic population-based cohort of school-age children. _Pediatr. Nephrol._ 29(9), 1589–1598 (2014). Article PubMed Google Scholar *
Luyckx, V. A. & Brenner, B. M. The clinical importance of nephron mass. _J. Am. Soc. Nephrol._ 21(6), 898–910 (2010). Article PubMed Google Scholar * Singh, G. R. & Hoy, W. E.
Kidney volume, blood pressure, and albuminuria: Findings in an Australian aboriginal community. _Am. J. Kidney Dis._ 43(2), 254–259 (2004). Article PubMed Google Scholar * Moskowitz, P.
S., Carroll, B. A. & McCoy, J. M. Ultrasonic renal volumetry in children: Accuracy and simplicity of the method. _Radiology_ 134(1), 61–64 (1980). Article CAS PubMed Google Scholar *
Holloway, H., Jones, T. B., Robinson, A. E., Harpen, M. D. & Wiseman, H. J. Sonographic determination of renal volumes in normal neonates. _Pediatr. Radiol._ 13(4), 212–214 (1983).
Article CAS PubMed Google Scholar * Jones, T. B., Riddick, L. R., Harpen, M. D., Dubuisson, R. L. & Samuels, D. Ultrasonographic determination of renal mass and renal volume. _J.
Ultrasound Med._ 2(4), 151–154 (1983). Article CAS PubMed Google Scholar * Braconnier, P. et al. How reliable is renal ultrasound to measure renal length and volume in patients with
chronic kidney disease compared with magnetic resonance imaging? _Acta Radiol._ 61(1), 117–127 (2020). Article PubMed Google Scholar * Wu, Q. et al. Evaluation of nine formulas for
estimating the body surface area of children with hematological malignancies. _Front. Pediatr._ 10, 989049 (2022). Article PubMed PubMed Central Google Scholar * Aguas-Ayesa, M. et al.
Revisiting the beyond BMI paradigm in excess weight diagnosis and management: A call to action. _Eur. J. Clin. Invest._ 54(7), e14218 (2024). Article PubMed Google Scholar * Obrycki, Ł.
et al. Kidney length normative values in children aged 0–19 years—a multicenter study. _Pediatr. Nephrol._ 37(5), 1075–1085 (2022). Article PubMed Google Scholar * Kim, J. H., Kim, M. J.,
Lim, S. H., Kim, J. & Lee, M. J. Length and volume of morphologically normal kidneys in Korean children: ultrasound measurement and Estimation using body size. _Korean J. Radiol._
14(4), 677–682 (2013). * Brancaforte, A. et al. Renal volume assessment with 3D ultrasound. _Radiol. Med._ 116 (7), 1095–1104 (2011). Article CAS PubMed Google Scholar * Liu, Y. et al.
Application of computer-assisted surgery in pediatric mediastinal tumor surgery. _Int. J. Med. Robot_. 19(2), e2489 (2023). Article PubMed Google Scholar * Su, L. et al. Clinical
application of a three-dimensional imaging technique in infants and young children with complex liver tumors. _Pediatr. Surg. Int._ 32(4), 387–395 (2016). Article PubMed Google Scholar *
Chandra, J., Mathur, S., Mittal, S. K. & Mittal, K. P. Sonographic assessment of renal volume in Indian children. _Indian J. Pediatr._ 66(2), 175–178 (1999). * Oswald, J. et al. Age and
lean body weight related growth curves of kidneys using real-time 3-dimensional ultrasound in pediatric urology. _J. Urol._ 172(5 Pt 1), 1991–1994 (2004). Article PubMed Google Scholar *
Schmidt, I. M., Mølgaard, C., Main, K. M. & Michaelsen, K. F. Effect of gender and lean body mass on kidney size in healthy 10-year-old children. _Pediatr. Nephrol._ 16(4), 366–370
(2001). Article CAS PubMed Google Scholar * Ezeofor, S. N., Anyanwu, G. E. & Obikili, E. N. Reference indices for evaluating kidney dimensions in children using anthropometric
measurements. _SA J. Radiol._ 24(1), 1882 (2020). PubMed PubMed Central Google Scholar * Schmidt, I. M. et al. Kidney growth in 717 healthy children aged 0–18 months: A longitudinal
cohort study. _Pediatr. Nephrol._ 19(9), 992–1003 (2004). Article PubMed Google Scholar * Dinkel, E. et al. Kidney size in childhood. Sonographical growth charts for kidney length and
volume. _Pediatr. Radiol._ 15(1), 38–43 (1985). Article CAS PubMed Google Scholar * Otiv, A., Mehta, K., Ali, U. & Nadkarni, M. Sonographic measurement of renal size in normal Indian
children. _Indian Pediatr._ 49(7), 533–536 (2012). Article CAS PubMed Google Scholar * Fujita, N. et al. Ultrasonographic reference values and a simple yet practical formula for
estimating average kidney length in Japanese children. _Clin. Exp. Nephrol._ 26(8), 808–818 (2022). Article PubMed PubMed Central Google Scholar * Duminda, W. D. et al. Ultrasonographic
length of morphologically-normal kidneys in children presented to a premier tertiary healthcare setting of Sri Lanka. _BMC Nephrol._ 20(1), 183 (2019). Article CAS PubMed PubMed Central
Google Scholar Download references ACKNOWLEDGEMENTS We would like to thank the Department of Pediatrics, the Affiliated Hospital of Qingdao University and all the researchers who
contributed to this paper. In addition, we appreciate the cooperation of parents. Informed consent has been obtained from all subjects and/or their legal guardians. FUNDING This work is
supported by Shandong & Chongqing Science and technology cooperation project (CSTB2023TIAD-LDX0029). AUTHOR INFORMATION Author notes * Yao Liu and Ning Xu contributed equally to this
work. AUTHORS AND AFFILIATIONS * Department of Pediatric Surgery, The Affiliated Hospital of Qingdao University, No. 16, Jiangsu Road, Shinan District, Qingdao, Shandong, China Yao Liu, Ning
Xu, Rongkun Zhu, Yuhe Duan, Xiwei Hao & Qian Dong * Shandong Provincial Key Laboratory of Digital Medicine and Computer-Assisted Surgery, Qingdao, China Yao Liu, Ning Xu, Xia Yang,
Feifei Wang, Fengjiao Wang, Xue Chen, Chenyuan Bian, Nan Xia & Qian Dong * Department of Digital Medicine and Computer-Assisted Surgery, The Affiliated Hospital of Qingdao University,
Qingdao, China Xia Yang, Feifei Wang, Fengjiao Wang & Chenyuan Bian * Institute for Digital Digital Medicine and Computer-Assisted Surgery, Qingdao University, Qingdao, China Xue Chen
& Nan Xia Authors * Yao Liu View author publications You can also search for this author inPubMed Google Scholar * Ning Xu View author publications You can also search for this author
inPubMed Google Scholar * Xia Yang View author publications You can also search for this author inPubMed Google Scholar * Feifei Wang View author publications You can also search for this
author inPubMed Google Scholar * Fengjiao Wang View author publications You can also search for this author inPubMed Google Scholar * Rongkun Zhu View author publications You can also search
for this author inPubMed Google Scholar * Yuhe Duan View author publications You can also search for this author inPubMed Google Scholar * Xiwei Hao View author publications You can also
search for this author inPubMed Google Scholar * Xue Chen View author publications You can also search for this author inPubMed Google Scholar * Chenyuan Bian View author publications You
can also search for this author inPubMed Google Scholar * Nan Xia View author publications You can also search for this author inPubMed Google Scholar * Qian Dong View author publications
You can also search for this author inPubMed Google Scholar CONTRIBUTIONS Y.L. contributed to data curation, formal analysis, methodology, visualization, and Writing—original draft . N.X.
was responsible for data curation and formal analysis. X.Y. contributed to data analysis and visualization. F.W., F. W. contributed visualization. R.Z., Y.D., X.H. oversaw the project
through supervision and review. X. C., C.B., N.X. contributed to reviewing, language editing, and supervision. Q.D. was responsible for conceptualization, funding acquisition, project
administration, resource provision, and final review and editing. All authors approved the final version of the manuscript, with the first author ensuring that all authors have read and
agreed to the manuscript’s contents. CORRESPONDING AUTHORS Correspondence to Nan Xia or Qian Dong. ETHICS DECLARATIONS COMPETING INTERESTS The authors declare no competing interests. ETHICAL
APPROVAL Ethical approval was obtained from the Ethics Committee of the Affiliated Hospital of Qingdao University and Qingdao Women and Children’s Hospital (Approval No. QYFY WZLL 29043).
ADDITIONAL INFORMATION PUBLISHER’S NOTE Springer Nature remains neutral with regard to jurisdictional claims in published maps and institutional affiliations. ELECTRONIC SUPPLEMENTARY
MATERIAL Below is the link to the electronic supplementary material. SUPPLEMENTARY MATERIAL 1. RIGHTS AND PERMISSIONS OPEN ACCESS This article is licensed under a Creative Commons
Attribution-NonCommercial-NoDerivatives 4.0 International License, which permits any non-commercial use, sharing, distribution and reproduction in any medium or format, as long as you give
appropriate credit to the original author(s) and the source, provide a link to the Creative Commons licence, and indicate if you modified the licensed material. You do not have permission
under this licence to share adapted material derived from this article or parts of it. The images or other third party material in this article are included in the article’s Creative Commons
licence, unless indicated otherwise in a credit line to the material. If material is not included in the article’s Creative Commons licence and your intended use is not permitted by
statutory regulation or exceeds the permitted use, you will need to obtain permission directly from the copyright holder. To view a copy of this licence, visit
http://creativecommons.org/licenses/by-nc-nd/4.0/. Reprints and permissions ABOUT THIS ARTICLE CITE THIS ARTICLE Liu, Y., Xu, N., Yang, X. _et al._ Kidney volume measurement and predictive
modeling in children aged 0–18 years using a computer-assisted surgery system. _Sci Rep_ 15, 15426 (2025). https://doi.org/10.1038/s41598-025-99680-8 Download citation * Received: 27
November 2024 * Accepted: 22 April 2025 * Published: 02 May 2025 * DOI: https://doi.org/10.1038/s41598-025-99680-8 SHARE THIS ARTICLE Anyone you share the following link with will be able to
read this content: Get shareable link Sorry, a shareable link is not currently available for this article. Copy to clipboard Provided by the Springer Nature SharedIt content-sharing
initiative KEYWORDS * Kidney volume * Children * Computer-assisted surgery * 3D reconstruction