Chert outcrops differentiation by means of low-field nmr relaxometry
- Select a language for the TTS:
- UK English Female
- UK English Male
- US English Female
- US English Male
- Australian Female
- Australian Male
- Language selected: (auto detect) - EN
Play all audios:
ABSTRACT Siliceous rocks served as raw materials in the production of stone tools from the Middle Paleolithic onwards. Due to migration, the provenance of archaeological artefacts can differ
from their natural outcrop location. The aim of this work was the application of 1D and 2D low-field nuclear magnetic resonance (LF-NMR) relaxometry to distinguish cherts by their original
source. Herein, bedded cherts and accompanying nodular cherts coming from three different outcrops of Kraków-Częstochowa Upland were investigated. 1D and 2D (_T__1__-T__2__)_ experiments of
water-saturated and dry rock sample states delivered _T__1_, _T__2_ times and _T__1__/T__2_ ratios of distinct hydrogen populations – parameters sensitive to pore size, surface properties,
and hydrogen bonding length. In-depth analysis of NMR data showed substantial differences in the porosity, pore surface and pore structure properties of investigated chert samples tested in
the three different saturation levels (100% water-saturated, dried and differential). Finally, principal component analysis (PCA) was performed to reduce the number of correlations obtained
and highlight the most important NMR properties specific to the particular outcrop localization."Please check captured corresponding author email if correct.""The email is
correct" SIMILAR CONTENT BEING VIEWED BY OTHERS LINKING STRUCTURAL AND COMPOSITIONAL CHANGES IN ARCHAEOLOGICAL HUMAN BONE COLLAGEN: AN FTIR-ATR APPROACH Article Open access 21 October
2020 SHORTWAVE INFRARED HYPERSPECTRAL IMAGING AS A NOVEL METHOD TO ELUCIDATE MULTI-PHASE DOLOMITIZATION, RECRYSTALLIZATION, AND CEMENTATION IN CARBONATE SEDIMENTARY ROCKS Article Open access
05 November 2021 MOLECULAR FINGERPRINTS RESOLVE AFFINITIES OF RHYNIE CHERT ORGANIC FOSSILS Article Open access 13 March 2023 INTRODUCTION Accurately determining the source of siliceous
artefacts and establishing links between them and archaeological discoveries seems to be crucial in the context of studying the migration of prehistoric cultures1,2,3,4,5,6. Understanding
the origin of silica raw materials in prehistoric communities could potentially shed new light on prehistoric trade networks and community interactions. However, there is no standardized,
objective methodology that utilizes nondestructive techniques to investigate the petrophysical, mineralogical, and geochemical characteristics of chert samples for their natural outcrop
differentianion2,3. The Upper Jurassic sediments of the Kraków-Częstochowa Upland (KCU) have attracted attention from both geologists and archaeologists due to the presence of siliceous
rocks, as noted in previous studies1,2. However the criteria used in typological classifications of artefacts from archaeological sites in Central-Eastern Europe are subjective, ambiguous,
and lack a connection to the geological context1. The artefacts are often classified based on macroscopic features that are not precisely defined. Therefore, the artefacts made of siliceous
raw material from one outcrop may be classified as belonging to different regions of origin of the raw material, or macroscopically similar artefacts from different regions may be classified
as the same variety. Previous attempts to identify the sources of archaeological artefacts have primarily relied on macroscopic characteristics such as colour diversity, shape variations,
cortex features, and width measurements. However, these efforts predominantly focused on stone inventories from archaeological sites, neglecting a comprehensive characterization of siliceous
rocks in their natural outcrops1,2. Furthermore, it is worth highlighting that many petrophysical research methods, like Nuclear Magnetic Resonance (NMR), have been underutilized in
archaeological investigations, despite the wealth of information they can provide. The NMR method has been widely used to study rock cores1. H relaxometry in low-field NMR (LF-NMR) has been
repeatedly applied to investigate the porosity and permeability of carbonates7, shales8,9,10,11 and recently, even cherts12 commonly thought as non-porous. LF-NMR has shown the capability to
investigate the pore structure as well as pore surface processes and surface features. Therefore non-invasive LF-NMR method can be used to identify and describe the total porosity,
including open as well as closed porosity, in the full-size range from nanoporosity to macroporosity and chemically bound hydrogens (mainly hydroxyl groups). This is possible due to the
specificity of the method (sensitivity to all hydrogen species), the experimental setup (dedicated radiofrequency coils enabling very short echo time, _TE_, and hence, the registration of
very short _T__2_s, and low magnetic field) and measurements in different water saturation states of a sample. LF-NMR can also deliver more detailed information about the sample, such as
free and bound fluid content, pore size distribution, surface processes (adsorption), and chemical features (bond lengths of a bonded fraction) without the need to destroy it13. A previous
study has shown12, that one- (1D) and two-dimensional (2D) LF-NMR was able to distinguish between bedded cherts and nodular cherts from the Upper Jurassic sediments (of the KCU region) based
on the differences in porosity, even though the total porosity did not exceed 2%. This showed that those two types of cherts bear their genetic information enclosed in very specific
porosity features that LF-NMR is able to detect. This promising result has prompted a wider application of LF-NMR in more challenging studies of siliceous rocks. In this paper, the potential
of LF-NMR to classify bedded and nodular cherts by outcrop based on NMR relaxometry analysis was investigated. GEOLOGICAL BACKGROUND The siliceous rocks present in the Upper Jurassic
limestones of the Southern part of the KCU belong to the microbial-sponge megafacies, whose outcrops span from Portugal to the Caucasus region. A distinctive feature of these formations is
the significant lithological uniformity observed across extensive areas2. KCU is situated in the Silesian-Kraków Homocline, built up of Triassic, Jurassic and Cretaceous sedimentary rocks.
The Upper Jurassic sediments comprise massive facies, bedded facies, and submarine gravity flows14,15,16,17,18. Three silicification types and products were distinguished in these facies:
nodular cherts, bedded cherts, and epigenetic siliceous rocks which are products of synsedimentary, early-to-late-diagenetic, or epigenetic
processes1,2,14,15,18,19,20,21,22,23,24,25,26,27,28. Many factors have influenced silicification processes in the KCU region: carbonate host-rock properties, including facies and
microfacies, mineralogy, porosity and chemical composition. The genesis of silicification types is not entirely understood and it is the subject of various studies1,2,18,25,26,27,28,29.
However, only nodular cherts and bedded cherts reveal a clear relationship to the limestone facies in which they occur, in contrast to epigenetic siliceous rocks whose occurrence is not
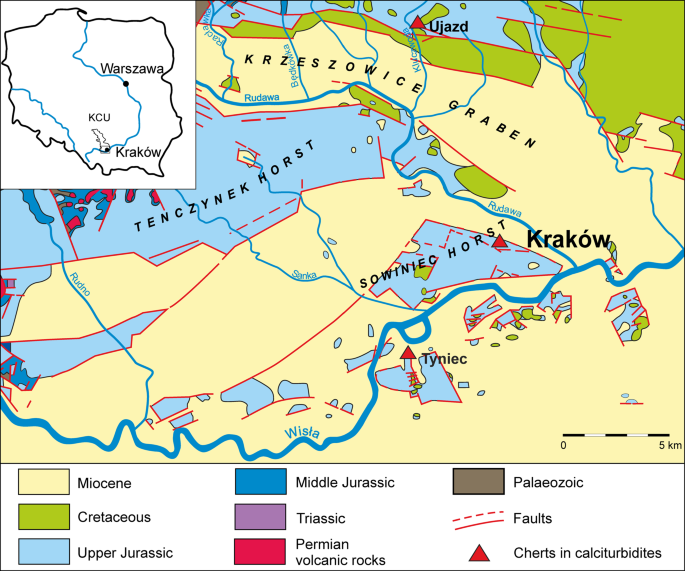
clearly related to any limestones2. A characteristic feature of all bedded chert outcrops is their occurrence near the margins of tectonic grabens (Fig. 1) and they have already been
described several times in the literature2,12,20,24,29. The bedded cherts occur in an outcrop in Ujazd located near the northern edge of the Krzeszowice Graben, in a disused quarry at
Sowiniec Horst and in an exposure in the eastern part of Wielkanoc Quarry on the Tyniec Horst (Fig. 1). The bedded cherts form layers up to half a meter thick and with lengths up to a few
meters in calciturbidites which represent a gravity flow deposits from the top of the Upper Jurassic (Oxfordian/Kimmeridgian turn) profile from the southern part of KCU1,2,18,24. In the
Ujazd outcrop, in addition to bedded cherts, horizons of nodular cherts arranged parallelly to the bedded plane occur. It can be discerned that characteristic concentric growth layers are
present in bedded cherts. In contrast to the other siliceous rocks, bedded cherts are characterized by normal fractional grading, the absence of relics of non-silicified limestones, and
silicified macrofauna1. MATERIALS AND METHODS ROCK CORE SAMPLES In total, 9 rock cores were cut from the samples collected from 3 outcrops located in the southern KCU. SB1 was a core of
bedded chert from Sowiniec Horst; SA9, SA9!a, SA9!b were cores of bedded cherts and SA3, SA8 were cores of nodular cherts from Ujazd, samples SC1, SC2, and SC4b were bedded cherts cores from
the Wielkanoc Quarry at Tyniec (Fig. 1). Sample SB1 was collected from the outer part of the bedded cherts layer from the outcrop of the Sowiniec Horst. Samples SA9 and SA9!a were sampled
from the outer, while SA9!b was from the inner part of the bedded cherts layer from the Ujazd outcrop. In Tyniec 3 layers of bedded cherts occur. A sample was taken from each layer. Sample
SC4b was from the inner part of the lowest bedded cherts layer, SC2 from the outer part of the middle layer, and SC1 from the outer part of the top layer (Fig. 2). The colours of the bedded
chert layers vary from creamy, grey or brownish to dark-creamy, while at the same time, the colours of the inner parts of the chert beds are generally darker and grade outside to brighter
shades. As for nodular cherts: sample SA3 was taken from beneath a layer of bedded cherts and SA8 from above a layer of bedded cherts in the Ujazd outcrop (Fig. 2). The colours of nodular
cherts vary from grey to dark grey and black. A more detailed analysis of the macro- and microscopic features of cherts from the studied outcrops of the KCU region is described in previous
studies1,2. CHEMICAL ANALYSES Major chemical components were determined using lithium metaborate/tetraborate fusion- ICP (Suplementary Table S1 and Table 2 containing components relevant in
this study). Samples were prepared and analyzed in a batch system. Each batch contains a method reagent blank, certified reference material and 6% replicates. Samples were mixed with a flux
of lithium metaborate and lithium tetraborate and fused in an induction furnace. The molten melt was immediately poured into a solution of 5% nitric acid containing an internal standard and
mixed continuously until completely dissolved oxides and selected trace elements on an ICP. The geochemical analyses were carried out at Activation Laboratories Ltd. in Ancaster, Canada.
MERCURY INJECTION CAPILLARY PRESSURE (MICP) MICP measurements were conducted using the Micromeritics AutoPore IV 9520 mercury porosimeter. Rock core samples were crushed and dried at 105 °C
for 24 h dried to remove moisture from the pore spaces and then cooled to room temperature (API-RP 40/98, ASTM-D4404-10, 2010). The analysis was carried out assuming the sample evacuation to
50 µmHg (6.67 Pa) for 2 min and the equilibrium time of 10 s. Pressure was measured at 82 points in the range of 2–60 000 psi (0.01-413.69 MPa). MICP delivered surface-area-to-volume ratios
(S/V) of a probed pore space (Table 2). MAGNETIC SUSCEPTIBILITY MEASUREMENTS Magnetic susceptibility measurements were performed using a Bartington MS2 meter (Bartington Instruments Ltd.)
in combination with a sensor for laboratory magnetic susceptibility measurements. The role of the sensor is played here by a thermally stable oscillator and an induction coil, which affects
the oscillator frequency. In a situation where there are no bodies with magnetic properties near the coil, the oscillator frequency depends only on the magnetic permeability of the air. If a
sample with magnetic properties is near the coil, the magnetic permeability of this sample modulates the oscillation frequency. The device performs its own calibration of the oscillation
frequency, which is converted to magnetic susceptibility. Measured mass (χm) and volume (_χ__sample_) magnetic susceptibilities are shown in Table 2. NUCLEAR MAGNETIC RESONANCE THEORY It has
been shown that homonuclear dipolar couplings and scalar effects are responsible for most of the NMR relaxation mechanisms of fluids in rock31,32,33. The former deals with the interaction
of proton spins in a liquid or bound on a rock surface. For the latter, the relaxation time is then determined by the interaction of water protons and the magnetic moment of ions having
unpaired electrons32,33. The strength of homonuclear dipolar couplings can be assessed by measuring longitudinal (_T__1_) and transverse (_T__2_) relaxation times, which are described by the
following formulas:32 $$\:\frac{1}{{T}_{1}}=2 C\left[\frac{2\tau\:}{1+{\omega\:}^{2}{\tau\:}^{2}}+\frac{8\tau\:}{1+4{\omega\:}^{2}{\tau\:}^{2}}\right],$$ (1)
$$\:\frac{1}{{T}_{2}}=C\left[6\tau\:+\frac{10\tau\:}{1+{\omega\:}^{2}{\tau\:}^{2}}+\frac{4\tau\:}{1+4{\omega\:}^{2}{\tau\:}^{2}}\right],$$ (2) where \(\:\tau\:\) is the correlation time of
dipolar interactions, \(\:\omega\:\) is the Larmor frequency and \(\:C\) is a constant. The above formulas show the dependency of relaxation times on the single correlation time for
simplicity (in reality, we deal with two correlation times of rotational and tumbling motions of a molecule). They can help to analyze the values of experimental relaxation times on a
molecular level. For example, the correlation time increases with the immobilization, and for nonmobile species one gets \(\:\omega\:\tau\:\gg\:1\) and consequently
\(\:\frac{{T}_{1}}{{T}_{2}}\sim\:{\omega\:}^{2}{\tau\:}^{2}\gg\:1\). Therefore, based on the ratio it is possible to assess the mobility of a given hydrogen population. Moreover1, 1H
standard Larmor frequency changes for complex chemical compounds containing hydrogen due to the changing chemical environment. The change of \(\:\omega\:\) for those hydrogens in chemical
structures is called a chemical shift (\(\:{\delta\:}_{H}\)). For example, for hydroxyl groups (OH) relevant in this study, it is linearly dependent on the infrared vibrational frequency
(\(\:{\nu\:}_{OH}\)) of the species in the given \(\:{\nu\:}_{OH}\) intervals (the dependence is non-linear in the whole range of stretching frequencies). The example of empirical formulas
connecting \(\:{\delta\:}_{H}\) with \(\:{\nu\:}_{OH}\) are:34 $$\:{\delta\:}_{H}=57.1-0.0147{\nu\:}_{OH},$$ (3) for surface hydroxyls and $$\:{\delta\:}_{H}=37.7-0.0092{\nu\:}_{OH},$$ (4)
for hydrogen-bonded protons (for example of the hydrate water in solids). For bonded protons, the empirical relation for \(\:{\delta\:}_{H}\) in connection to the bond length was also found:
$$\:{\delta\:}_{H}=4.65\cdot\:{r}_{OH}^{-1}-17.4,$$ (5) Therefore, the change in relaxation times is also dependent on the chemical shift (local molecular environment of1 1H) and the bond
length as shown in the case of hydroxyls. Macroscopically, the observed (experimental) \(\:{T}_{1}\) and \(\:{T}_{2}\) relaxation times are the effective values depending on the dephasing
due to bulk liquid interactions (\(\:{T}_{1/2,\:bulk}\)), surface interactions (\(\:{T}_{1/2,\:surface}\)) and diffusion due to gradients induced by the differences in magnetic
susceptibilities (\(\:{T}_{2,\:diffusion}\)):35 $$\:\frac{1}{{T}_{1}}=\frac{1}{{T}_{1,\:bulk}}+\frac{1}{{T}_{1,\:surface}},$$ (6)
$$\:\frac{1}{{T}_{2}}=\frac{1}{{T}_{2,\:bulk}}+\frac{1}{{T}_{2,\:surface}}+\frac{1}{{T}_{2,\:diffusion}}\approx\:\frac{298\eta\:}{3{T}_{K}}+\frac{{\rho\:}_{2}S}{V}+\frac{{\left(\gamma\:{G}_{ind}TE\right)}^{2}D}{12},$$
(7) where \(\:{T}_{1/2,\:bulk}\) is relaxation for water unaffected by sink mechanisms, \(\:{T}_{K}\) (K) is temperature and \(\:\eta\:\) (Pa∙s) is viscosity, \(\:{\rho\:}_{1/2}\) (m/s) is
surface relaxivity (the strength of the surface to cause additional spins dephasing and echo amplitude decrease) and \(\:\frac{S}{V}\) (1/m) is surface-area to volume ratio of a confining
geometry, \(\:D\) (m2/s) is diffusion coefficient, \(\:\gamma\:\) (1/T∙s) is the gyromagnetic ratio, \(\:TE\) (s) is echo time and \(\:{G}_{ind}\) (T/m) is the internal constant gradient
equal to \(\:\frac{{\Delta\:}\chi\:{B}_{0}}{d}\), where \(\:{B}_{0}\) (T) is the external magnetic field induction, \(\:d\) (m) is pore diameter and \(\:{\Delta\:}\chi\:\) the difference
between volume magnetic susceptibilities of saturating fluid (\(\:\chi\:\)\(\:{}_{fluid}\)) and a sample’s matrix (\(\:{\chi\:}_{sample}\)). Based on those formulas, pore sizes and surface
properties can be assessed. For example, in a system, where surface relaxation dominates the ratio of \(\:\frac{{T}_{1}}{{T}_{2}}\approx\:\frac{{T}_{1,\:surface}}{{T}_{2,\:surface}}\)
reflects the adsorption energy36. LF-NMR EXPERIMENTS Each of the samples was measured in the three water saturation states in the following order: (1) dried (for 12 h at 200oC); (2)
saturated (for 24 h in distilled water under vacuum and room temperature conditions). Saturated samples were protected with a residual amount of plastic foil (0,06 g) to avoid evaporation of
the absorbed water. In addition, samples were examined in a (3) differential state, which is an artificial saturation state obtained via subtracting dry sample raw data from the saturated
sample raw data. In this approach, only movable water was characterized, which informed us about open porosity. 1D-_T__1_, 1D-_T__2_ and _T__1_-_T__2_ NMR experiments were carried out for
samples in dry (D), saturated (S) and differential (SD) saturation states on a 2 MHz Magritek Rock Core Analyzer (Aachen, Germany) applying Inversion Recovery (IR), Carr − Purcell − Meiboom
− Gill (CPMG) and combined IR-CPMG sequences, respectively. Key parameters are shown in Table 1. 1D distributions were calculated in Prospa software (Magritek, Aachen, Germany) using Inverse
Laplace Transform (ILT) applying the Lawson and Hanson method and _T__1_ − _T__2_ correlation maps applying the FISTA algorithm37. From all 1D _T__2_ distributions cumulative porosities
(_φ__i_) were calculated (Supplementary Table S4), where _i_ indicated a saturation state. By using standard LF-NMR protocol9 on saturated and dry samples data _T__2cutoff_ values (_T__2_ of
the boundary between irreducible and movable water) were obtained, thus main porosity parameters: bulk-volume irreducible (_BVI_), free-fluid index (_FFI_), saturated water irreducible
(_SWI_) and Total Porosity could be estimated (Supplementary Table S3). 1D-_T__2_ (_T__2lm_) and 1D-_T__1_ (_T__1lm_) logarithmic means of distributions were also determined. Peaks visible
on 1D distributions were numbered Xi starting from the lowest relaxation time, where X indicated a saturation state (d, s, sd for 1D-_T__1_ and D, S, SD for 1D-_T__2_) for which a
distribution was obtained, and i = 1, 2, …, _n_, where _n_ is a total number of peaks (Supplementary Tables S2 and S4, respectively). Peaks visible on 2D distributions were numbered numbered
according to the following classification: (1) _T__2_ ~ 0,05 ms, _T__1_ ~ 20 ms; (2) _T__2_ ~ 0,1 ms, _T__1_ ~ 100 ms; (3) _T__2_ ~ 0,1 ms, _T__1_ ~ 10 ms; (4) _T__2_ ~ 1 ms, _T__1_ ~ 1 ms;
(5) _T__2_ ~ 1 ms, _T__1_ ~ 10 ms; (6) _T__2_ ~ 1 ms, _T__1_ ~ 100 ms; (7) _T__2_ ~ 20 ms, _T__1_ ~ 200 ms; (8) _T__2_ ~ 20 ms, _T__1_ ~ 300–1600 ms; (9) _T__2_ ~ 130–200 ms, _T__1_ ~
400–2000 ms (Supplementary Table S5). PORE SIZE DISTRIBUTION (PSD) PSDs were estimated for differential state distributions, since only them represent the open (effective) pore space and
therefore correspond to reference MICP measurements in which only the penetrable pore throat system is observed. Firstly, surface relaxivity, \(\:{\rho\:}_{2}\), was estimated (Supplementary
Table S3) using the commonly used approximation \(\:\frac{1}{{T}_{2}}\approx\:\frac{1}{{T}_{2,\:surface}}\). This is usually valid for rocks with none or weak paramagnetic doping, for which
diffusional component can be minimized by the short echo time, _TE_ (Table 1) and the application of the small magnetic field \(\:{B}_{0}\) of 0.05 T. Since the bulk relaxation,
\(\:{T}_{2,\:bulk}\) is much larger than registered relaxation times _T__2_, Eq. (7) can be reduced to surface component only yielding approximate surface relaxation:38,39,40
$$\:{\rho\:}_{2}={\left({T}_{2,\:surface}\cdot\:\frac{S}{V}\right)}^{-1},$$ (8) where \(\:{T}_{2,\:surface}={T}_{2}\), and in application logarithmic mean of _T__2_ distribution in
differential state was used to obtain the effective value of surface relaxivity for the whole PSD41. Secondly, we accounted for the fact that diffusion relaxation occurs, and water molecules
are less mobile in nanopores, which causes the decrease of diffusivity. This was made by substituting constant diffusion coefficient in Eq. (7) with function _D_(_d_), where _D_ is
diffusion coefficient and _d_ is pore diameter. To find _D_(_d_) function regression analysis was performed and based on literature values of diffusion coefficient42,43,44,45,46,47. logistic
function was fitted (Supplementary Fig. 1). It is worth noting that the choice of _D_(_d_) function did not influence the resulting PSD if it fulfilled the following requirements: (1)
_D_(_d_ < 1 nm) = 0.045∙10−9 m2/s; (2) maximal _D_(_d_) = _D__bulk_, where _D__bulk_ is a diffusion coefficient of bulk water. Finally, PSD was calculated in MATLAB (The MathWorks, Inc.,
Natick, USA) using the following formula obtained on the basis of Eq. (7):12 $$\:C\cdot{d}^{2}-4\cdot\:{\rho\:}_{2}\cdot\:d-D\left(d\right)\cdot\:F=0,$$ (9) where
\(\:C=\frac{1}{{T}_{2}}-\frac{1}{{T}_{2,\:bulk}}\), \(\:F=\frac{1}{12}{\left(\gamma\:\varDelta\:\chi\:{B}_{0}TE\right)}^{2}\), \(\:{T}_{2,\:bulk}=2.2\:s\) and \(\:{T}_{2}\) is transverse
relaxation time obtained in the experiment. For comparison, PSDs were calculated using a common approach in which diffusional component was omitted (Supplementary Fig. 4), assuming
cylindrical pore shapes, as only valid for obtained surface relaxivity values, using:12 $$\:{d}_{approx}={4{\rho\:}_{2}\cdot\:T}_{2},$$ (10) The difference between distributions then
reflects the influence of diffusion. APPLICATION We wanted to diversify the collected samples as much as possible so that the results of their differentiation would not be biased. For
example, the research group included samples of bedded cherts that were taken not only from different outcrops but also from different parts of the bedded chert layers (inner and outer).
Thanks to this, it was possible to assess which NMR parameter distinguishes samples based on a given criterion and to find a set of parameters that will divide the entire group of samples
depending on the outcrop. Moreover, our goal was to find the reasons for the differences in the obtained relaxation times and other derived NMR parameters for the samples. Because relaxation
time in rocks reflects many properties at the same time, the problem is quite complex and requires extensive analysis, which was carried out in the following steps. First, longitudinal and
transverse relaxation experiments were performed, and correlation maps of these processes were measured for dry and saturated samples. Later, it was checked whether there are relationships
between geochemical and NMR parameters, which allowed for insight into the extent to which the chemical composition determines the value of a given NMR parameter (for example, how the
relaxation time changes depending on the content of ferromagnetic iron in siliceous rock matrix). Then, the relaxometric results were characterized in such a way as to identify the source of
a given peak in the 1D and 2D distributions of relaxation times and their differences depending on the sample silicification type (bedded/nodular), outcrop localization and position in
chert layer (for bedded cherts). The next step was to determine correlations between relaxometric parameters and the chemical composition of investigated samples, as well as to estimate the
pore size distribution (PSD) and examine whether there were sufficient differences to distinguish outcrops. Finally, principal component analysis (PCA) was performed on the various sets of
parameters that differed among the outcrops in the above steps to check whether those differences were significant enough for the samples clustering according to their place of origin. PCA
is the culmination of analyzing the differences between outcrops in a statistical manner. It highlighted key NMR parameters that determined the grouping of samples from different outcrops,
which could speed up the discrimination process in the future by reducing the number of necessary experiments and analysis steps. The described workflow is presented schematically in Fig. 3.
POROSITY DATA VALIDATION As the reference for NMR porosity determination methods, results of mass-volume measurements obtained during the samples preparation process for LF-NMR experiments
were used. Mass-volume porosity (φmass−vol) was calculated by comparing the saturated density of a sample (mass of 100% water-saturated sample per unit volume) to its bulk density (the mass
of a dry sample per unit volume), with respect to saturating fluid (water) density, according to Eq. (11):
$$\:{\varPhi\:}_{mass-vol}=\frac{{m}_{sat}-{m}_{dry}}{{\rho\:}_{w}{V}_{sample}}\cdot\:100,$$ (11) where msat and mdry are the mass of saturated and dried samples respectively (g); ρw is the
density of water (g/cm3); and Vsample is the bulk volume of the sample in dry state (cm3). The results of mass-volume porosity measurements are shown in Supplementary Table S3. Results of
cross-validation between mass-volume porosity and open porosity derived from differential distributions are shown in Supplementary Figure S6. PRINCIPAL COMPONENT ANALYSIS (PCA) The PCA was
performed using the PQStat software (Poznań, Poland). It consists of transforming the set of primary variables into a new set of variables (principal components) based on statistical
information (the correlation between primary variables). This analysis is used to reduce the number of variables and simplify the process of finding samples with similar characteristics. A
more detailed description of the calculation and interpretation methods can be found in12. PCA was carried out for three data sets: (1) _T__2_ times of all peaks visible in the 1D-_T__2_
distributions of the dry and saturated samples numbered depending on the region of occurrence, porosity for a given saturation state and _T__2cutoff_ ; (2) _T__2_ times of all hydrogen
populations visible in the 2D _T__1_-_T__2_ correlation maps obtained from saturated samples numbered depending on the region of occurrence (see Sect. 2.3); (3) _T__2_ times of all hydrogen
populations visible in the maps obtained from saturated samples and associated _T__1__/T__2_ ratios, and contents of SiO2 and CaO as dominant compounds. Additionally, three supplementary PCA
were performed (Supplementary Figure S5) for the following datasets: (S1) chemical composition; (S2) chemical composition and parameters from a standard NMR porosity analysis protocol
_T__2cutoff_,_BVI_ and _FFI_; (S3) _T__2_ times from maps of saturated samples, and corresponding _T__1_/_T__2_ ratios, similarly to (3) but with standard chemical parameters used for chert
samples differentiation: _Fe__2__O__3__/TiO__2_ and _Al__2__O__3__/(Al__2__O__3_ _+ Fe__2__O__3__)_.48 RESULTS AND DISCUSSION The bedded cherts under analysis were composed mainly of SiO2,
CaO and Fe2O3 (significant components from the point of view of NMR relaxometry; Table 2). The nodular cherts (SA3 and SA8) had a higher content of SiO2 and Fe2O3 on average than bedded
cherts. All samples, besides SA9!a appear to exhibit chemical characteristics similar to the Ocean Ridge environment of deposition (Supplementary Figure S3b) with a strong influence of
hydrothermal activity in the silicification process (Supplementary Figure S3d). Sample SA9!a undergone a lower degree of silicification, as evidenced by the lowest SiO2 and highest CaO
content (Table 2). What is noteworthy is that the other commonly used charts of chemical element ratios48 have proved ineffective in attempting any differentiation of the studied samples
(Supplementary Figure S3a, c). As described above, discriminant diagrams of the major chemical components as well as geochemical results have proven ineffective at distinguishing between the
different chert outcrop locations. However, these findings further confirm that hydrothermal activity related to extensional tectonics in the Late Jurassic had a great influence on
silicification processes in the calciturbidite sediments of the KCU area2,26,28,49. OUTCROPS DIFFERENTIATION BASED ON ONE-DIMENSIONAL TECHNIQUES CORRELATION BETWEEN CHEMICAL COMPOSITION AND
NMR PARAMETERS 1D NMR relaxometry of the samples delivered _T__1_ (Supplementary Figure S2) and _T__2_ times distributions (Fig. 4), from which besides the _T__1_s and _T__2_s of the
observed peaks, logarithmic means, porosities (from 1D-_T__2_ experiments) and the ratio of _T__1lm_/_T__2lm_ were calculated (Supplementary Table S4). Distributions for the rocks in the
saturated state correspond to the total porosity, in the differential state to the open porosity, and in the dry state to the closed porosity. Porosity represented by saturated. and to a
greater extent, dry states is influenced by signals from the chemically bound hydrogen and adsorbed water signals. The ratio of _T__1lm_/_T__2lm_ is a parameter which can inform us about the
effective adsorption strength in the sample36. According to Fleury and Romero-Sarmiento50, water in pores has _T__1_/_T__2_ ~ 2 and the stronger bounding of hydrogen (smaller pores, viscous
fluid, adsorbed water, chemically bound hydrogen), the higher the ratio is observed. Porosities, _T__2lm_s and _T__1lm_/_T__2lm_ were checked on the correlation with chemical compound
content and the following observations were made: * dependency between SIO2AND CAO CONTENT (Fig. 5a) WAS LINEAR, while, interestingly, EXPONENTIAL BETWEEN SIO2AND FE2O3 (Fig. 5b)
illustrating lower reduction of the calciturbidite host-rock matrix due to silicification in samples from outer parts of bedded cherts bed and the increasing influence of iron content and
silica abundance in all measured cherts samples; * DIFFERENTIAL POROSITY INCREASED EXPONENTIALLY WITH CAO CONTENT (Fig. 5c), which indicates that the main part of the open porosity of the
studied cherts is related to the residual carbonate content; * DRY POROSITY WAS CONSTANT (0.2%) FOR SAMPLES FROM THE OUTER PARTS OF BEDDED CHERTS LAYERS IN TYNIEC AND SOWINIEC HORST
OUTCROPS, WHILE INCREASED LINEARLY WITH SIO2CONTENT FOR ALL BEDDED CHERT SAMPLES FROM UJAZD AND SC4B SAMPLE FROM THE INNER PART OF BEDDED CHERTS LAYER IN TYNIEC OUTCROP (Fig. 5d). In low CaO
content samples, high dry porosity could be connected to the significant number of inclusions (closed pores and structural hydroxyls). For high CaO content (observed for samples from outer
parts of chert beds) it occurs due to irreducible capillary-bound water, which is commonly observed for carbonates7. Only samples from the outer parts of bedded cherts layer in Ujazd exhibit
an increased number of closed pores in their SiO2 matrix showing the unique NMR characteristic of all bedded chert samples from this outcrop. * _T__2LM_FROM THE SATURATED STATE INCREASED
EXPONENTIALLY WITH CAO CONTENT (Fig. 5e), while LINEARLY FOR THE DIFFERENTIAL STATE (as expected for pore bulk water) showing the constant increase in signal from open porosity in bigger
pore spaces with increased carbonate content as well as disruption effect of this relationship by the influence of chemically bound hydrogen and adsorbed water information in the signal of a
100% water-saturated sample. (Fig. 5i). At the same time, a lesser effect of the carbonate content on the increase in T2lm in the Ujazd samples is evident, as is a similarly weaker effect
of iron content on its decrease; * both saturated and differential _T__2LM_DECREASED EXPONENTIALLY WITH FE2O3 (Fig. 5g, k), which can be connected to the influence of silicification over
pore size reduction. Also in this case we observe weaker emanation of this phenomenon in all Ujazd samples; * _T__1LM_/_T__2LM_OF SATURATED AND DIFFERENTIAL STATES WAS INDEPENDENT OF CAO
CONTENT (mean equal to around 4.17 and 2.15, respectively; the lower mean was observed in the differential state, because it reflects movable water in pores, while the saturated state
combines also chemically bound hydrogen and adsorbed water signal having higher _T__1_/_T__2_) EXCEPT FOR FOUR SAMPLES: NODULAR CHERTS AND BEDDED CHERTS: SA9!B AND SC4B (Fig. 5f, j) (THESE
SAMPLES WERE CUT FROM THE INNER PARTS OF THE BEDDED CHERT LAYERS AND HAD THE HIGHEST SILICA CONTENT and their _T__1lm_/_T__2lm_ = 10-27.9 and 3.55–7.61 in the saturated and differential
state, respectively). This suggests that high values observed for the samples from the inner part of the bedded chert layer and nodular cherts correspond to tighter voids (based on
differential state), strongly adsorbing surface of the crystal lattice and possibly structural hydroxyls (based on saturated state); It can also be seen that the content of just 3% CaO
(excluding outliers) dominates the effective _T__1_/_T__2_ for the sample, probably due to the significantly lower content of porosity in the SiO2 matrix. The influence of Fe2O3 content on
_T__1lm_/_T__2lm_ exhibits similar but reversed characteristics as of CaO (Fig. 5h, l). _T__1lm_/_T__2lm_ was constant for the bedded chert samples from the outer parts of bedded chert
layers, with Fe2O3 content up to 0.61%. However, for higher Fe2O3 content the increase in the _T__1lm_/_T__2lm_ ratio was observed. _T_ _2_ DISTRIBUTIONS On 1D-_T__2_ distributions five
different hydrogen populations (peaks) could be distinguished (Fig. 4). They were numbered from 1 to 5 for the following _T__2_ regions: 0,1–1 ms, ~ 1–10 ms, ~ 10–50 ms, ~ 50–150 ms, >
150 ms. In the dry state, all samples were similar in terms of peak positions (Fig. 4, first column). Differences can be seen in peak amplitudes and the number of visible peaks. The main
observations according to differences among samples are: * SA9!A STOOD OUT WITHIN ITS GROUP DUE TO VERY HIGH CAO CONTENT, which suggests the significant occurrence of carbonate host-rock
residues in the sample, that are characterized by bigger voids with higher _T__2_s; * SC4B SHOWED A HIGHER ABUNDANCE OF SHORT_T__2_AND A LACK OF HIGH_T__2_HYDROGEN POPULATIONS in comparison
to other samples from the same outcrop and to the SA9!b sample that also comes from the inner part of the bedded chert layer. Only this sample was so strongly saturated in the tighter spaces
with _T__2_ = 1–10 ms (the characteristic regions that are predominantly saturated in nodular cherts are _T__2_ ~ 1 ms and _T__2_ ~ 4–40 ms in bedded cherts, which suggests that SC4b has
mixed features of open porosity which are characteristic for nodular and bedded cherts, according to12); * AFTER WATER SATURATION POROSITY INCREASED 1.1–8.7 TIMES, WHILE_T__2LM_1.2–29 TIMES:
the smallest changes were observed for samples SA3 and SA8 (1.4- and 1.1-times higher porosity and 1.4- and 1.2-times higher _T__2lm_, respectively) pointing to the lowest connectivity of
nodular cherts pore space and the highest proportion of closed porosity relative to total porosity; * OUTCROPS DIFFERED IN TERMS OF SAMPLES’ DYNAMIC CHANGES IN POROSITY (AMOUNT AND SIZE,
reflected in porosity and _T__2lm_ change, respectively): the average ratio of saturated and dry porosities for samples within the outcrop groups were equal to 2.1, 2.2 and 4.9 (2.1, 2.9 and
4.9 excluding nodular cherts), while 3.5, 1.6 and 16.2 in case of _T__2lm_ (3.5, 1.7 and 16.2 excluding nodular cherts) for the Sowiniec Horst, Ujazd, and Tyniec, respectively. PORE SIZE
DISTRIBUTIONS PSDs were calculated from Eq. (10) using 1D-_T__2_ data from obtained differential distributions and shown in Fig. 6. Next, PSDs were divided into meso- and macroporosity
according to IUPAC classification51 and geometric averages of pore sizes were calculated (Supplementary Table S4). The following characteristic features of samples were observed: * NO
MICROPOROSITY occurred in the chert samples SA3, SA8 and SA9!a; * ALL SAMPLES EXHIBIT THE MAJORITY OF OPEN PORES IN THE MESOPORES REGIME regardless of their position in the layer.
Simultaneously nodular chert samples were characterized by pore space only in the range of mesopores (Fig. 6). * sample SA9 HAD THE MOST MICROPORES (0.1%), sample SA9!A HAD THE MOST
MESOPORES (2.7%), and sample SC2 HAD THE MOST MACROPORES (0.1%); * DIFFERENCES IN MEAN RATIOS OF MICRO-, MESO- AND MACROPORES CAN BE FOUND AMONG OUTCROPS: 18% micropores, 78% mesopores and
4% macropores in Sowiniec Horst; 4.4% micropores, 93.9% mesopores and 1.7% macropores in Ujazd; 7.5% micropores, 89.7% mesopores and 2.8% macropores in Tyniec; * OUTCROPS DIFFERED IN TERMS
OF THE OPEN POROSITY PSD LOGARITHMIC MEANS: 12.1 nm, 10.2 nm and 10 nm for the Ujazd, Sowiniec Horst and Tyniec outcrops, respectively. ONE-DIMENSIONAL TECHNIQUES: SUMMARY In summary, based
on one-dimensional data, significant differences were found between nodular and bedded cherts, inner and outer bedded chert layer parts and different outcrops. Many NMR parameters are
directly correlated to the chemical composition, based on which it is impossible to directly differentiate outcrops as chemical information strongly determines visible lithological
differences between samples. Therefore, such descriptive data interpretation is insufficient to roughly divide samples to their natural source location. However, some of the observations
suggest subtle differences among outcrops related to the changes in open and closed porosity, bounding strengths of pore space, mean pore sizes and abundance of macro and micro-porosity.
Despite that, a lot of obtained data is unrelated to outcrop differentiation and should be filtered out. Thus, 1D data sets have been considered in PCA. OUTCROPS DIFFERENTIATION BASED ON
TWO-DIMENSIONAL TECHNIQUES IDENTIFICATION OF HYDROGEN POPULATIONS ON _T_ _1_-_T_ _2_ CORRELATION MAPS This method delivered diversified _T__1_-_T__2_ correlation maps, where nine different
peaks can be distinguished (Supplementary Table S5). The specific nature of the experiment allowed the association of each peak to a different hydrogen population. In the dry state,
diversified signals can be seen. These may stem from chemically bound hydrogen, strongly adsorbed, or trapped water (which is unable to escape in the heating process, which can be observed
for very tortuous pores) and inclusions, as hypothesized previously12. CHEMICALLY BOUND HYDROGEN-HYDROXYLS Chemical bonding in the form of hydroxyl groups (OH) is usually indicated by _T__2_
= 0.06–0.2 ms and _T__1_/_T__2_ = 400–500,52,53 as in the case of characteristically elongated peaks 1 and 2. In silicates, OH bonds can be formed in silanols (Osilanol–Hsilanol), between
free water molecules (Owater–Hwater) and between silanol16O and free water1H (Osilanol– Hwater). The hydrogen bonding lengths in these pairs are equal to 0.92, 1.8 and 1.72 Å,
respectively54. Higher values of _T__2_ for peak 2 than for peak 1 with a preserved high value of _T__1_/_T__2_ ratio suggests weaker silanol hydrogen bonding strength. It was shown that a
higher chemical shift was proportional to hydrogen bonding length55. Therefore, one possible scenario is that peak 1 comes from silanols, i.e., hydrogen chemically bound in the sample’s
matrix, while peak 2 comes from Osilanol– Hwater. The other scenario is that peak 1 comes from silanols from the deep matrix (structural OH), while peak 2 is from silanols on the open pores
surface56. Because of similar _T__1_/_T__2_, those peaks characterize the covalent bonds rather than H-bonds with molecular water. These hypotheses can be transferred to the surface
containing Ca(OH)2, where OH also might be formed between molecular water and calcium oxide. After water saturation, some samples were also significantly saturated in population S1/SD1
(Figs. 8 and 9), which indicates that new silanols can be formed in the saturation process. ADSORBED/SURFACE WATER The reported signature signal of water adsorbed on the silica surface for
silica glass was _T__2_ ~ 1 ms and _T__1__/T__2_ ~ 64, and for synthetic samples MCM-41 and SBA-15 was reported to be equal to _T__2_ ~ 2 ms and _T__1__/T__2_ ~ 7 and 45 for MCM-41 and
SBA-15, respectively53,56. In this study, this population is represented by peak 6, especially since it was not visible in the saturated state, probably because its signal averaged with pore
bulk water resolved as a single peak. Peak 3 also suits the adsorbed water criterion in terms of _T__2_, having _T__1__/T__2_ values in the range of 36–103. Slightly higher values suggest
that peak 3 can also represent very small pores, where water is entrapped between pore walls and surface water relaxation dominates, especially since it is also visible on differential maps
reflecting movable water. PORE WATER Based on the _T__1__/T__2_ = 1.8–26 it can be suspected that despite _T__2_ ~ 1 ms peak 5 comes from water entrapped in small pores rather than adsorbed
water, and this signal is also visible as movable water (Fig. 9). Increased _T__1__/T__2_ for these two peaks can result from the fact that in small pores higher relative number of molecules
feels the attraction from the surface, and the concept is called layering47. Other peaks come from populations in pores in general (meaning that pore bulk water dominated), while the larger
the _T__2_ the larger the pore and the larger the _T__1_/_T__2_ the stronger immobilization of water in a pore. Those populations identified as pore water in the dry state came from
inclusions. After water saturation, some peaks disappeared from the maps, which can result from their low abundance in the whole porosity population and thus low signal intensity compared to
the saturated regions (Fig. 8). Another hypothesis is that those disappeared hydrogen populations averaged with more abundant populations (for example, surface water with bulk water in a
pore) and were not resolved as a separate peak. The most frequent samples were saturated in the regions represented by S3, S5, S7 and S9, which suggests that open porosity was associated
with bigger pores. QUALITATIVE ASSESSMENT OF OUTCROPS’ MAPS DIFFERENCES In this two-dimensional experiment, some differences among outcrops can be noticed. In general, the obtained _T__2_
values were in the range of ~ 0,02-1000 ms, with peaks ranging from 0.0398 to 589 ms (_T__1_/_T__2_ = 0,2-1739), 0.0398 to 105 ms (_T__1_/_T__2_ = 1-2138) and 0.0282 to 97.7 ms
(_T__1_/_T__2_ = 1.15–535) for dry (Fig. 7), saturated (Fig. 8) and differential (Fig. 9) states, respectively (Supplementary Table S5). Dividing those ranges into outcrops, in: * Sowiniec
Horst: _T__2_ = 0.0398-129 ms (_T__1_/_T__2_ = 1.32–1739), 0.182–42.7 ms (_T__1_/_T__2_ = 1.51-83) and 0.112-49 ms (_T__1_/_T__2_ = 1.86-20); * Ujazd: _T__2_ = 0.0525-589 ms (_T__1_/_T__2_ =
0.2–1739), 0.0457-39.8 ms (_T__1_/_T__2_ = 2.29–381) and 0.0646-45.7 ms (_T__1_/_T__2_ = 1.62–190); * Tyniec: _T__2_ = 0.158-209 ms (_T__1_/_T__2_ = 0.31–659), 0.0398-105 ms (_T__1_/_T__2_
= 1-2138) and 0.0282-97.7 ms (_T__1_/_T__2_ = 1.15–535), for the dry, saturated and differential states, respectively. The differences are mostly visible on the maps obtained for dry
samples, especially on the _T__2_ profiles of the maps. SB1 has a wide profile with no specifically distinguished peaks, Ujazd samples are dominated by the peak D7, and for nodular cherts
shorter _T__2_ peaks are marked, Tyniec samples had multiple well-separated peaks. Outcrops can also be ordered from having the widest _T__2_ profile and largest _T__1_/_T__2_ of open
(differential state) and total (saturated state) porosity as follows: Tyniec, Ujazd and Sowiniec Horst. TWO-DIMENSIONAL TECHNIQUES: SUMMARY _T__1__/T__2_ correlation maps emphasized
differences among outcrops based on the open and total porosity, but also subtle differences in chemically bound hydrogen populations and inclusions. Such an experiment better resolves the
complex system of hydrogen species, which can vary due to many factors depending on the different courses of silicification processes in individual calciturbidite outcrops. Due to the
complexity of the maps and the specificity of the 2D Laplace Transform it cannot be clearly stated if the differences are sufficient to resolve between outcrops or they rather resulted from
ambiguity of the transformation. Therefore, 2D data sets were also subjected to PCA analysis to reduce information noise and leave only statistically significant data from the perspective of
outcrop differentiation. PRINCIPAL COMPONENT ANALYSIS (PCA) ASSESSMENT OF THE OUTCROP SEPARATION ABILITY OF DIFFERENT DATASETS The differences that were found in the analysis of the
chemical composition and NMR data did not provide sufficient evidence to conclude that there is a certain feature of the samples that determines the outcrop. Hence, the statistical analysis
was made by using PCA. As shown in the workflow, first the basic parameters obtained from individual experiments were tested, and then the most different features were combined to check how
they would affect the result of the PCA analysis. Basic parameters describing a rock core sample such as chemical composition, and if NMR is used, petrophysical quantities such as BVI or FFI
fail in separating outcrops (Supplementary Figure S5). In the next step, more detailed NMR parameters were tested in combined sets, which reflect comprehensive information about the samples
related to their chemical structure, porosity system and pore surface features. The results are shown in Fig. 10 and the primary observations are: * _T__2CUTOFF_, _T__2_TIMES AND POROSITIES
FROM DRY AND SATURATED SAMPLES WERE CAPABLE OF RESOLVING THREE OUTCROPS (1D _T__2_ times alone did not deliver the expected results), but groups are close to each other, and this may lead
to incorrect grouping by an independent tester (for example one might classify Tyniec and Ujazd as a single outcrop); * _T__2_TIMES FROM THE_T__1_-_T__2_CORRELATION EXPERIMENT OF SATURATED
SAMPLES SHOWED AN EXCELLENT OUTCROP SEPARATION ABILITY THROUGH “HYDROXYLS FEATURES” AND “PORES FEATURES”, RESPECTIVELY (Factor 1 connects S1 associated with structural OH bonding and S3
associated with surface water adsorbed physically or chemically through H-bonds, while Factor 2 S4 and S5 peaks associated with pore water); * COMBINED SET OF THE ABOVEMENTIONED_T__2_TIMES,
_T__1_/_T__2_RATIOS AND SIO2AND CAO CONTENT PRESERVED THE EARLIER OUTCROP SEPARATION and introduced stronger Tyniec samples clustering and Ujazd samples collinearity; * USING A DATASET
WITH_FE__2__O__3__/TIO__2_AND_AL__2__O__3__/(AL__2__O__3_ _+ FE__2__O__3__)_FACTORS DID NOT INTRODUCE ANY VISIBLE CHANGE OF SEPARATION. As indicated in Sect. 3, almost all samples were
related to the same environment of deposition - Ocean Ridge with an influence of hydrothermal activity in the silicification process. Therefore, the introduction of chemical tectonic-setting
parameters into the PCA analysis did not yield new results in comparison to the approach with SiO2 and CaO content (Supplementary Figure S5c). RELATIONSHIPS BETWEEN NMR PARAMETERS AND
SAMPLE MICRO-CHARACTERISTICS PCA analysis revealed and clarified relationships between NMR parameters and sample characteristics related to chemical structure and porosity features: * S3 and
S7 were strongly correlated, so THERE WAS A CORRELATION BETWEEN_T__2_OF SURFACE AND PORE WATER POPULATIONS, which means that they may come from the same pore type (e.g. in terms of size),
where surface relaxation dominates the pore relaxation time; * SiO2 was positively correlated with _T__2_ of S1 and CaO was positively correlated with _T__2_ of S3, which together with
individual samples occurrence indicates that _T__2_OF STRUCTURE OH GROUPS WAS SENSITIVE TO THE DEGREE OF SILICIFICATION AND CRYSTALLINITY INDEX equal to around 2.3, 5 for bedded cherts from
Ujazd and Tyniec samples and 6–7 for nodular cherts2, respectively. More crystalline samples were characterized by lower _T__2_ of OH in silanols (i.e. OH covalent bonding), which shifted
towards higher values in more amorphous systems. * Factor 2 in Fig. 10b connected to the _T__2_OF WATER IN PORES S4 AND S5 DISCRIMINATED THE SAMPLES WITH DIFFERENT CALCITURBIDITE HOST ROCK
PRIMARY STRUCTURE CHARACTERISTICS: These open pore populations occurred mainly for Sowiniec Horst and Tyniec outcrops. for Ujazd cherts this populations were lower or did not occur at all; *
the correlation of S3 and S7 with CaO and the cluster of bedded cherts from different outcrops and no correlation between _T__2_ and _T__1_/_T__2_ of peak S7 indicated that THE SIZE OF OPEN
POROSITY WAS MAINLY DEPENDENT ON THE CAO CONTENT, BUT THE PORE SURFACE CHARACTERISTICS OF THOSE PORES DEPENDED ON THE PRIMARY DEPOSITIONAL STRUCTURES OF CARBONATE HOST-ROCK and thus also
separated the Ujazd outcrop from the rest. RELATIONSHIPS BETWEEN NMR PARAMETERS AND OUTCROPS PCA analysis highlighted differences in NMR parameters that contributed most to the
differentiation of outcrops. It should be emphasized that it was possible to distinguish outcrops not thanks to certain parameters, but to the accumulated information about the sample
contained in the entire dataset. Some features were found that together with the observations provided in Sect. 3.1 and 3.2 made it possible to divide outcrops. These features are: * Tyniec
samples evinced the capability to form new silanols after the water saturation (S1 appeared only after water saturation); * Tyniec samples had residual surface water in the dry state (peak
D3); * Ujazd samples were characterized by the strongest water absorption in pores S5 and S7 (based on _T__1_/_T__2_), with the highest adsorption energy for nodular cherts; * Ujazd samples
lacked open porosity represented by population S4 and had the smallest pores in population S5; * Sowiniec Horst sample separates from others based on the biggest open pores (based on Fig.
10b and c sample lies between vectors representing S3, S4 and S7); * Sowiniec Horst sample had the strongest OH bonds; * Sowiniec Horst sample had the largest amount of signal interpreted as
inclusions (peak D9); * Sowiniec Horst sample had the largest surface roughness in the population represented by peak 5. CONCLUSIONS Simple chemical composition data and different
macroscopic features are insufficient to distinguish between cherts samples. In the study, we showed that LF-NMR results reflect complex information about porous space including closed
(inclusions) and open porosity, rock-matrix chemical structure and geological features such as structures of carbonate host rock or position of sample in bedded chert layer. In most cases
single NMR parameter represents a mix of those features. However, some subtle differences in NMR parameters were emphasized in the statistical analysis made by PCA. Our complex analysis
helped to characterize samples and indicated the features common to their position in the bedded chert layer, primary depositional structures of carbonate host-rock, silicification type and
finally – source outcrop. This objective approach for the classification of siliceous rocks can be further tested on a larger set and help to enhance the sometimes-subjective archaeological
studies of siliceous artefacts not only from the KCU region but also from other regions of natural chert outcrops occurrence. DATA AVAILABILITY Data used to reach the conclusion of this
study is presented in the paper and the Supplementary Materials. Source data is provided via https://doi.org/10.17632/5bcym49f67.2 at Mendeley Data repository with CC BY 4.0 license.
REFERENCES * Matyszkiewicz, J. & Kochman, A. The provenance of siliceous rocks from the Kraków-Częstochowa Upland (Poland) used as raw materials in the manufacture of siliceous artefacts
from Central-Eastern Europe; an old problem in new light. _J. Archaeol. Sci. Rep._34, 102600 (2020). Google Scholar * Kochman, A., Matyszkiewicz, J. & Wasilewski, M. Siliceous rocks
from the southern part of the Kraków-Częstochowa Upland (Southern Poland) as potential raw materials in the manufacture of stone tools – A characterization and possibilities of
identification. _J. Archaeol. Sci. Rep._30, 102195 (2020). Google Scholar * Chatzimpaloglou, P. A geoarchaeological methodology for sourcing chert artefacts in the Mediterranean region: a
case study from neolithic Skorba on Malta. _Geoarchaeology_. 35, 897–920 (2020). Article Google Scholar * Purdy, B. & Brooks, H. Thermal alteration of silica minerals: an
Archaeological Approach. _Sci. (1979)_. 173, 322–325 (1971). CAS Google Scholar * Olivares, M. et al. Non-destructive spectrometry methods to study the distribution of archaeological and
geological chert samples. _Spectrochim Acta Mol. Biomol. Spectrosc._73, 492–497 (2009). Article ADS Google Scholar * Hassler, E. R., Swihart, G. H., Dye, D. H. & Li, Y. S.
Non-destructive provenance study of chert using infrared reflectance microspectroscopy. _J. Archaeol. Sci._40, 2001–2006 (2013). Article CAS Google Scholar * Fheed, A. & Krzyżak, A. A
textural and diagenetic assessment of the Zechstein limestone carbonates, Poland using the transverse nuclear magnetic resonance relaxometry. _J. Pet. Sci. Eng._152, 538–548 (2017). Article
CAS Google Scholar * Habina, I., Radzik, N., Topór, T. & Krzyżak, A. T. Insight into oil and gas-shales compounds signatures in low field 1H NMR and its application in porosity
evaluation. _Microporous Mesoporous Mater._252, 37–49 (2017). Article CAS Google Scholar * Krzyżak, A. T., Habina-Skrzyniarz, I., Machowski, G. & Mazur, W. Overcoming the barriers to
the exploration of nanoporous shales porosity. _Microporous Mesoporous Mater._298, 110003 (2020). Article Google Scholar * Mukhametdinova, A., Habina-Skrzyniarz, I., Kazak, A. &
Krzyżak, A. NMR relaxometry interpretation of source rock liquid saturation — a holistic approach. _Mar. Pet. Geol._132, 105165 (2021). Article CAS Google Scholar * Krzyżak, A. T., Mazur,
W., Fheed, A. & Węglarz, W. P. Prospects and challenges for the spatial quantification of the diffusion of fluids containing 1H in the Pore System of Rock cores. _J. Geophys. Res. Solid
Earth_. 127, 23299 (2022). Article ADS Google Scholar * Krzyżak, A. T., Mazur, W., Matyszkiewicz, J. & Kochman, A. Identification of Proton Populations in Cherts as Natural analogues
of pure silica materials by means of low field NMR. _J. Phys. Chem. C_. 124, 5225–5240 (2020). Article Google Scholar * Elsayed, M. et al. A review on the applications of nuclear magnetic
resonance (NMR) in the oil and gas industry: laboratory and field-scale measurements. _J. Pet. Explor. Prod. Technol._12, 2747–2784 (2022). Article Google Scholar * Dżułyński, S. The
origin of the Upper jurassic limestones in the Cracow area. _Rocz. Pol. Towarz. Geol._21, 125–180 (1952). Google Scholar * Matyszkiewicz, J. Sedimentation and diagenesis of the Upper
Oxfordian cyanobacterial-sponge limestones in Piekary near Kraków. _Ann. Soc. Geol. Pol._59, 201–232 (1989). Google Scholar * Matyszkiewicz, J. & Microfacies _Sedimentation and some
Aspects of Diagenesis of Upper Jurassic Sediments from the Elevated Part of the Northern Peri-Tethyan Shelf: A Comparative Study on the Lochen Area (Schwäbische Alb) and the Cracow Area
(Cracow-Wieluń Upland, Poland)_vol. 21 (Abh., 1997). Berliner geowiss. Google Scholar * Matyszkiewicz, J., Kochman, A. & Duś, A. Influence of local sedimentary conditions on development
of microbialites in the Oxfordian carbonate buildups from the southern part of the Kraków-Częstochowa Upland (South Poland). _Sediment. Geol._263–264, 109–132 (2012). Article ADS Google
Scholar * Matyszkiewicz, J. et al. Epigenetic silicification of the Upper Oxfordian limestones in the Sokole Hills (Kraków-Czêstochowa Upland): relationship to facies development and
tectonics. _Acta Geol. Pol._65, 181–203 (2015). Google Scholar * Bukowy, S. Geologia Obszaru pomiędzy Krakowem a Korzkwią. _Biul. Państwowego Instytutu Geologicznego_. 108, 17–82 (1956).
Google Scholar * Świerczewska, A. Early diagenetic silicification in the Upper Jurassic biohermal and interbiohermal faciesIn: Schild, R., Sulgostkowska, Z. (Eds.). in _Man and Flint,
Proceedings of the VIIth International Flint Symposium Warszawa-Ostrowiec Świętokrzyski. Institute of Archaeology and Ethnology Polish Academy of Sciences_ (eds. Schild, R. &
Sulgostkowska, Z.) 357–361 (Inst. Archeol. Etnol. PAN, Warszawa, 1995). * Alexandrowicz, S. W. Geological structure of the vicinity of Tyniec. _Biul. Państwowego Instytutu Geologicznego_.
152, 5–93 (1960). Google Scholar * Rajchel, J. Badania sedymentologiczne krzemieni jurajskich pod Krakowem. _Spraw z. Pos Kom Oddz PAN w Krakowie_. 14, 625–645 (1970). Google Scholar *
Sitarz, M., Wyszomirski, P., Handke, B. & Jeleń, P. Moganite in selected Polish chert samples: the evidence from MIR, Raman and X-ray studies. _Spectrochim Acta Mol. Biomol.
Spectrosc._122, 55–58 (2014). Article ADS CAS Google Scholar * Matyszkiewicz, J. The significance of Saccocoma-calciturbidites for the analysis of the Polish Epicontinental late jurassic
Basin: an Example from the Southern Cracow-Wielun Upland (Poland). _Facies_. 34, 23–40 (1996). Article Google Scholar * Matyszkiewicz, J. Epigenetic silification of the Upper Oxfordian
limestones in the vicinity of Kraków. _Ann. Soc. Geol. Pol._57, 59–87 (1987). CAS Google Scholar * Matyszkiewicz, J., Krajewski, M., Kochman, A., Kozłowski, A. & Duliński, M. Oxfordian
neptunian dykes with brachiopods from the southern part of the Kraków-Częstochowa Upland (southern Poland) and their links to hydrothermal vents. _Facies_. 62, 12 (2016). Article Google
Scholar * Kochman, A. & Matyszkiewicz, J. The development and origin of the two-stage silicification of Upper jurassic limestones from the northern part of the Kraków-Częstochowa Upland
(Southern Poland). _Geol. Geophys. Environ._49, 225–243 (2023). Article Google Scholar * Kochman, A., Kozłowski, A. & Matyszkiewicz, J. Epigenetic siliceous rocks from the southern
part of the Kraków-Częstochowa Upland (Southern Poland) and their relation to Upper jurassic early diagenetic chert concretions. _Sediment. Geol._401, 105636 (2020). Article Google Scholar
* Matyszkiewicz, J. & Olszewska, B. Osady podmorskich spływów grawitacyjnych pogranicza oksfordu i kimerydu w Ujeździe. _Volumina Jurassica_. 4, 109–117 (2007). Google Scholar *
Gradziński, R. Geological map of Kraków region without Quaternary and terrestrial tertiary deposits. _Instytut Nauk Geologicznych PAN_ Preprint at (2009). * Kleinberg, R. L., Kenyon, W. E.
& Mitra, P. P. Mechanism of NMR relaxation of fluids in Rock. _J. Magn. Reson. A_. 108, 206–214 (1994). Article ADS CAS Google Scholar * Bloembergen, N., Purcell, E. M. & Pound,
R. V. Relaxation effects in Nuclear magnetic resonance absorption. _Phys. Rev._73, 679–712 (1948). Article ADS CAS Google Scholar * Abragam, A. _The Principles of Nuclear Magnetism_vol.
32 (Oxford University Press, 1961). Google Scholar * Brunner, E., Karge, H. G. & Pfeifer, H. On the correlation between the 1H NMR Chemical Shift and the stretching vibration frequency
of hydroxyl groups in solids. _Z. für Phys. Chem._176, 173–183 (1992). Article CAS Google Scholar * Hürlimann, M. D. Ex Situ Measurement of One- and Two-Dimensional Distribution
Functions. in _Single-Sided NMR_ (eds. Casanova, F., Perlo, J. & Blümich, B.) 57–82 (Springer Berlin Heidelberg, Berlin, Heidelberg, 2011). Google Scholar * D’Agostino, C., Mitchell,
J., Mantle, M. D. & Gladden, L. F. Interpretation of NMR relaxation as a tool for characterising the adsorption strength of liquids inside porous materials. _Chem. – Eur. J._20,
13009–13015 (2014). Article PubMed Google Scholar * Teal, P. D. & Eccles, C. Adaptive truncation of matrix decompositions and efficient estimation of NMR relaxation distributions.
_Inverse Probl._31, 045010 (2015). Article ADS MathSciNet Google Scholar * Ge, X. et al. Determining the transverse surface relaxivity of reservoir rocks: a critical review and
perspective. _Mar. Pet. Geol._126, 104934(2021)."The following mandatory elements (Page numbers) of the reference are missing in the Manuscript. Please check and
verify.""Corrected" * Kleinberg, R. L. & Horsfield, M. A. Transverse relaxation processes in Porous Sedimentary Rock. _J. Magn. Reson._88, 9–19 (1990). ADS Google Scholar
* Hürlimann, M. D. Effective gradients in porous media due to susceptibility differences. _J. Magn. Reson._131, 232–240 (1998). Article ADS PubMed Google Scholar * Zhao, P. et al.
Nuclear magnetic resonance surface relaxivity and its advanced application in calculating pore size distributions. _Mar. Pet. Geol._111, 66–74 (2020). Article Google Scholar * Takahara, S.
et al. Neutron scattering study on dynamics of water molecules in MCM-41. _J. Phys. Chem. B_. 103, 5814–5819 (1999). Article CAS Google Scholar * Bourg, I. C. & Steefel, C. I.
Molecular dynamics simulations of water structure and diffusion in silica nanopores. _J. Phys. Chem. C_. 116, 11556–11564 (2012). Article CAS Google Scholar * Takahara, S., Sumiyama, N.,
Kittaka, S., Yamaguchi, T. & Bellissent-Funel, M. C. Neutron scattering study on dynamics of water molecules in MCM-41. 2. Determination of translational diffusion coefficient. _J. Phys.
Chem. B_. 109, 11231–11239 (2005). Article CAS PubMed Google Scholar * Lerbret, A., Lelong, G., Mason, P. E., Saboungi, M. L. & Brady, J. W. Water Confined in Cylindrical pores: a
Molecular Dynamics Study. _Food Biophys._6, 233–240 (2011). Article PubMed PubMed Central Google Scholar * Oulkadi, D., Yemloul, M., Desobry-Banon, S. & Canet, D. Water behavior in
hybrid silica gels as studied by 1H nuclear magnetic resonance relaxometry. Evidence of two hydration layers. _Microporous Mesoporous Mater._172, 213–216 (2013). Article CAS Google Scholar
* Milischuk, A. A. & Ladanyi, B. M. Structure and dynamics of water confined in silica nanopores. _J. Chem. Phys._135, 174709 (2011). Article ADS PubMed Google Scholar * Murray, R.
W. Chemical criteria to identify the depositional environment of chert: general principles and applications. _Sediment. Geol._90, 213–232 (1994). Article ADS CAS Google Scholar *
Migaszewski, Z. M., Gałuszka, A., Durakiewicz, T. & Starnawska, E. Middle Oxfordian-Lower Kimmeridgian chert nodules in the Holy Cross Mountains, south-central Poland. _Sediment.
Geol._187, 11–28 (2006). Article ADS Google Scholar * Fleury, M. & Romero-Sarmiento, M. Characterization of shales using T1-T2 NMR maps. _J. Pet. Sci. Eng._137, 55–62 (2016). Article
CAS Google Scholar * Thommes, M. et al. Physisorption of gases, with special reference to the evaluation of surface area and pore size distribution (IUPAC Technical Report). _Pure Appl.
Chem._87, 1051–1069 (2015). Article CAS Google Scholar * Fleury, M. et al. Characterization and quantification of water in smectites with low-field NMR. _J. Phys. Chem. C_. 117, 4551–4560
(2013). Article CAS Google Scholar * Krzyżak, A. T. & Habina, I. Low field 1H NMR characterization of mesoporous silica MCM-41 and SBA-15 filled with different amount of water.
_Microporous Mesoporous Mater._231, 230–239 (2016). Article Google Scholar * Ngo, D. et al. Hydrogen bonding interactions of H2O and SiOH on a boroaluminosilicate glass corroded in aqueous
solution. _Npj Mater. Degrad._4, 1 (2020). Article Google Scholar * Dib, E., Costa, I. M., Vayssilov, G. N., Aleksandrov, H. A. & Mintova, S. Complex H-bonded silanol network in
zeolites revealed by IR and NMR spectroscopy combined with DFT calculations. _J. Mater. Chem. Mater._9, 27347–27352 (2021). Article CAS Google Scholar * Orazio, F. D., Bhattacharja, S.,
Halperin, W. P., Eguchi, K. & Mizusaki, T. Molecular diffusion and nuclear-magnetic-resonance relaxation of water in unsaturated porous silica glass. _Phys. Rev. B_42,
9810-9818(1990)."The following mandatory elements (Page numbers) of the reference are missing in the Manuscript. Please check and verify.""Corrected" Download references
ACKNOWLEDGEMENTS The research leading to these results received funding from “Processes controlling the formation of chert nodules and bedded cherts in the Upper Jurassic sediments from the
Kraków-Częstochowa Upland” funded by the National Science Centre, Poland, contract No. UMO-2017/27/B/ST10/00594) for the period 2018-2021. The LF-NMR analysis was financially supported by
the Polish Ministry of Science and Higher Education via AGH University of Krakow statutory reserves (grant number 16.16.140.315/05). We would like to kindly thank E. Puskarczyk, C. Kapusta
and G. Opila for their help with magnetic susceptibility measurements and G. Machowski for his help with MICP measurements. AUTHOR INFORMATION AUTHORS AND AFFILIATIONS * Faculty of Geology,
Geophysics and Environmental Protection, AGH University of Krakow, al. Adama Mickiewicza 30, Krakow, 30-059, Poland Michał Fajt, Weronika Mazur-Rosmus, Anna Stefańska, Alicja Kochman &
Artur T. Krzyżak Authors * Michał Fajt View author publications You can also search for this author inPubMed Google Scholar * Weronika Mazur-Rosmus View author publications You can also
search for this author inPubMed Google Scholar * Anna Stefańska View author publications You can also search for this author inPubMed Google Scholar * Alicja Kochman View author publications
You can also search for this author inPubMed Google Scholar * Artur T. Krzyżak View author publications You can also search for this author inPubMed Google Scholar CONTRIBUTIONS M. F.
contributed to conceptualization, data curation, formal analysis, investigation, software, validation, visualization, writing – original draft and writing – review & editing. A. T. K.
contributed to conceptualization, funding acquisition, methodology, project administration, software, supervision, validation and writing - review & editing A. K. contributed to
conceptualization, funding acquisition, methodology, project administration, resources, supervision, validation, writing – original draft and writing – review & editing. W. M. - R.
contributed to conceptualization, data curation, formal analysis, investigation, methodology, software, writing – original draft and writing – review & editing. A. S. contributed to data
curation and investigation. CORRESPONDING AUTHOR Correspondence to Michał Fajt. ETHICS DECLARATIONS COMPETING INTERESTS The authors declare no competing interests. ADDITIONAL INFORMATION
PUBLISHER’S NOTE Springer Nature remains neutral with regard to jurisdictional claims in published maps and institutional affiliations. ELECTRONIC SUPPLEMENTARY MATERIAL Below is the link to
the electronic supplementary material. SUPPLEMENTARY MATERIAL 1 RIGHTS AND PERMISSIONS OPEN ACCESS This article is licensed under a Creative Commons Attribution 4.0 International License,
which permits use, sharing, adaptation, distribution and reproduction in any medium or format, as long as you give appropriate credit to the original author(s) and the source, provide a link
to the Creative Commons licence, and indicate if changes were made. The images or other third party material in this article are included in the article’s Creative Commons licence, unless
indicated otherwise in a credit line to the material. If material is not included in the article’s Creative Commons licence and your intended use is not permitted by statutory regulation or
exceeds the permitted use, you will need to obtain permission directly from the copyright holder. To view a copy of this licence, visit http://creativecommons.org/licenses/by/4.0/. Reprints
and permissions ABOUT THIS ARTICLE CITE THIS ARTICLE Fajt, M., Mazur-Rosmus, W., Stefańska, A. _et al._ Chert outcrops differentiation by means of low-field NMR relaxometry. _Sci Rep_ 14,
25280 (2024). https://doi.org/10.1038/s41598-024-75945-6 Download citation * Received: 09 January 2024 * Accepted: 09 October 2024 * Published: 25 October 2024 * DOI:
https://doi.org/10.1038/s41598-024-75945-6 SHARE THIS ARTICLE Anyone you share the following link with will be able to read this content: Get shareable link Sorry, a shareable link is not
currently available for this article. Copy to clipboard Provided by the Springer Nature SharedIt content-sharing initiative KEYWORDS * Bedded cherts * Nodular cherts * Flints * Relaxometry *
PCA * LF-NMR