A machine learning algorithm to explore the drivers of carbon emissions in chinese cities
- Select a language for the TTS:
- UK English Female
- UK English Male
- US English Female
- US English Male
- Australian Female
- Australian Male
- Language selected: (auto detect) - EN
Play all audios:
ABSTRACT As the world’s largest energy consumer and carbon emitter, the task of carbon emission reduction is imminent. In order to realize the dual-carbon goal at an early date, it is
necessary to study the key factors affecting China’s carbon emissions and their non-linear relationships. This paper compares the performance of six machine learning algorithms to that of
traditional econometric models in predicting carbon emissions in China from 2011 to 2020 using panel data from 254 cities in China. Specifically, it analyzes the comparative importance of
domestic economic, external economic, and policy uncertainty factors as well as the nonparametric relationship between these factors and carbon emissions based on the Extra-trees model.
Results show that energy consumption (ENC) remains the root cause of increased carbon emissions among domestic economic factors, although government intervention (GOV) and digital finance
(DIG) can significantly reduce it. Next, among the external economic and policy uncertainty factors, foreign direct investment (FDI) and economic policy uncertainty (EPU) are important
factors influencing carbon emissions, and the partial dependence plots (PDPs) confirm the pollution haven hypothesis and also reveal the role of EPU in reducing carbon emissions. The
heterogeneity of factors affecting carbon emissions is also analyzed under different city sizes, and it is found that ENC is a common driving factor in cities of different sizes, but there
are some differences. Finally, appropriate policy recommendations are proposed by us to help China move rapidly towards a green and sustainable development path. SIMILAR CONTENT BEING VIEWED
BY OTHERS CONSTRUCTION AND ANALYSIS OF CHINA’S CARBON EMISSION MODEL BASED ON MACHINE LEARNING Article Open access 17 April 2025 A MACHINE LEARNING APPROACH TO CARBON EMISSIONS PREDICTION
OF THE TOP ELEVEN EMITTERS BY 2030 AND THEIR PROSPECTS FOR MEETING PARIS AGREEMENT TARGETS Article Open access 03 June 2025 RESEARCH ON SPATIAL AND TEMPORAL DIFFERENCES OF CARBON EMISSIONS
AND INFLUENCING FACTORS IN EIGHT ECONOMIC REGIONS OF CHINA BASED ON LMDI MODEL Article Open access 17 May 2023 INTRODUCTION Greenhouse gas emissions, the curse of industrialization, have
created a severe threat to the global ecosystem. The sixth report of the Intergovernmental Panel on Climate Change (IPCC) for 2021 stated that greenhouse gas emissions over the past decade
have reached the highest level in human history1. It emphasized that there would be little prospect of limiting global warming to 1.5 °C without immediate and drastic measures taken on
emissions reductions2. This also put a tremendous strain on China, which has surpassed the U.S. in carbon emissions since 2004. In 2021 alone, China has emitted 11.47 billion tons of
greenhouse gas, or almost 30.9% of the total emissions worldwide. Therefore, how to optimize its carbon emissions has constantly attracted the attention of the academic circle worldwide.
China’s carbon emission reduction pathway is urgent for the early attainment of the dual-carbon target. The STIRPAT model3 was used as a guide for early studies of the topic. With strict
assumptions and derivations of this theoretical model, they established the dominant role of demographic, economic, and technological factors in the forecast of carbon emissions4. Recent
research has uncovered a complex interplay, revealing an increasing number of positively related determinants. These include domestic economic factors5; external economic factors6 and
uncertainties7,8,9, to name a few. Although these studies provide a new perspective into the issue, they usually employ variables from one single category to ensure the robustness of their
estimates10;11. As a result, an integrated perspective is currently lacking to assess the relative importance and interrelationships of these determinants. In light of this, we implemented
machine learning techniques. These approaches are superior to traditional econometrics in many aspects. First, since there are no a priori requirements on the distribution, machine learning
techniques allow flexibility in choosing the model’s functional form12. Second, we perform feature selection on multidimensional data to filter irrelevant variables, thereby avoiding the
overfitting problem that plagues traditional econometrics13. proposed an adaptive-Lasso method, which incorporates weights to automatically adjust the penalty factors. Third, machine
learning allows for interpretable prediction analysis because it ranks the importance of variables and analyzes partial dependency plots by evaluating the magnitude of each feature’s
contribution, leaving policymakers with room to weigh the results. For instance14, identified the drivers of carbon intensity and predicted the trend in China using a random forest
algorithm. To fill the existing research gaps, we collected annual data of 254 cities in China from 2011 to 2020 from the China Statistical Yearbook. We used multiple machine learning
algorithms for a comparative study and found that the Extra-Trees (Extremely Randomized Trees) algorithm is the most effective in studying the influencing factors of carbon emissions. It is
not only an integrated learning method, but it also improves the model’s generalization ability and stability by constructing multiple extremely randomized decision trees. There are three
contributions to this paper. First, there are numerous factors influencing China’s carbon emissions. To prevent model overfitting, existing studies either focus on the effects of fewer
factors or utilize the lasso model13, which fails to achieve the goal of screening variables. According to15, this paper employs the adaptive lasso model, which can eliminate factors that
aren’t very important and make the prediction model simpler. This fixes the model’s overfitting problem and keeps it from losing its ability to generalize. Second, we suggest using several
machine learning models to figure out what causes China’s carbon emissions. These algorithms will also show any non-parametric connections between carbon emissions and factors in China’s
economy, factors in other economies, and policy uncertainty by making the output simple to understand. Not only does the method accurately guess China’s carbon emissions, it also looks at
how each variable affects carbon emissions and how important they are by using a variable importance ranking and a partial correlation dependency plot16. Third, we also study the
heterogeneity of drivers by city size, which aids in formulating more effective decisions to reduce urban carbon emissions. This will help China’s urban carbon emissions move towards a more
sustainable path. We structure the rest of the paper as follows: Part 2 is a literature review. Part 3 describes the data and theoretical methodology. Part 4 reports the results of the
empirical study. Part 5 presents the conclusions and policy recommendations. LITERATURE REVIEW For the influencing factors affecting China’s carbon emissions, researchers have long
identified the impact of a variety of domestic economic factors, such as urbanization rate17, degree of marketization18, industrial structure19,20, human capital21, financial development22,
government intervention23, economic development24,25, energy consumption26,27, environmental regulation28, green total factor productivity29, green technological innovation30,31, digital
finance32, and fintech33, Environmental, Social, and Governance (ESG) investments34, Economic complexity35. 36 and 37 argued that heavy use of conventional energy sources leads to excessive
carbon emissions. Researchers also find that external shocks, including external openness38 and FDI39, may also affect China’s carbon emissions,. Finally, since pandemic, climatic and
economic shocks exacerbate world uncertainty, economic policy uncertainty (EPU)40, pandemic uncertainty (WPU)41, and climate policy uncertainty (CPU)42 may also have a part in affecting
carbon emissions. But if all the above-mentioned influencing factors are added to the prediction model, overfitting emerges and reduces the external validity and generalizability of the
estimates. Therefore, choosing an appropriate feature selection method is essential. Two types of dimension reduction methods, namely, unsupervised and supervised methods, are usually
adopted. Unsupervised dimension reduction algorithms include principal component methods, relief algorithms, etc. For example43, used PCA to reduce the input data dimensionality by removing
four principal constituents from the 16 potential influencing factors44. utilized an algorithm that combined the PACF and relief to filter the input variables. The supervised downscaling
algorithm includes the lasso model, by which45 remove extraneous factors affecting the carbon price. 15 and 46 optimized on this basis by adjusting the penalty factor using the automatic
introduction of weights, an approach known as the adaptive lasso model13. Likewise, Scholars have proposed various prediction models to study the future trend of carbon emissions in China.
Given the intent, these models are generally subdivided into two categories. One is referred to as unsupervised forecasting methods that predict based on the data. For example, scholars have
used multi-stage clustering to predict carbon emissions in G20 countries47, and factor analysis to identify key variables and use ELM to predict carbon intensity48. However, without
labeling the input data, the prediction results may be biased. The other is supervised learning with “labeling” which is more advantageous in prediction49. For instance, using decision trees
to predict differences in carbon emissions across industries50. Other researchers have used integrated learning based on decision trees to improve the generalizability of individual base
learners. For example, Xgboost, Random Forest and Bagging were used to predict carbon emissions51. Extra-trees, an algorithm optimized for Random Forests, have also been used to predict
emissions trends in China’s steel industry52. To sum up, the existing literature has the following insufficiencies. First, the current studies mainly use traditional econometric methods to
study the relationship between carbon emissions and one or two independent variables, which avoids overfitting but fails to consider the influence of other equally important drivers. Second,
machine learning models are often used to make predictions and few to interpret the results, not to mention discussing variable importance or conducting partial dependency plots. Third, the
importance of factors influencing carbon emissions may vary as cities scale up, which makes an analysis of urban heterogeneity essential to the current research. DATA DESCRIPTION AND
THEORETICAL METHODS DATA DESCRIPTION This research sample covers annual data from 2011 to 2020 for 254 cities in China. We select from the existing literature and identify the drivers of
carbon emissions. A total of 14 domestic economic factors, 2 external economic factors and 3 uncertainty factors, are selected and reported in Table 1. For data processing, a few outliers
are treated as missing values, which are processed by linear interpolation and moving average to make up the values, and the data have been standardized. Sources of data are China
Statistical Yearbook of Urban Construction, China Statistical Yearbook of Energy and China Statistical Yearbook, it can be seen from the descriptive statistics in Table 1. We found that the
standard deviation of green technology and digital finance is large, 1452.45 and 68.43 respectively, which may contain outliers. For detailed information and descriptive statistics of this
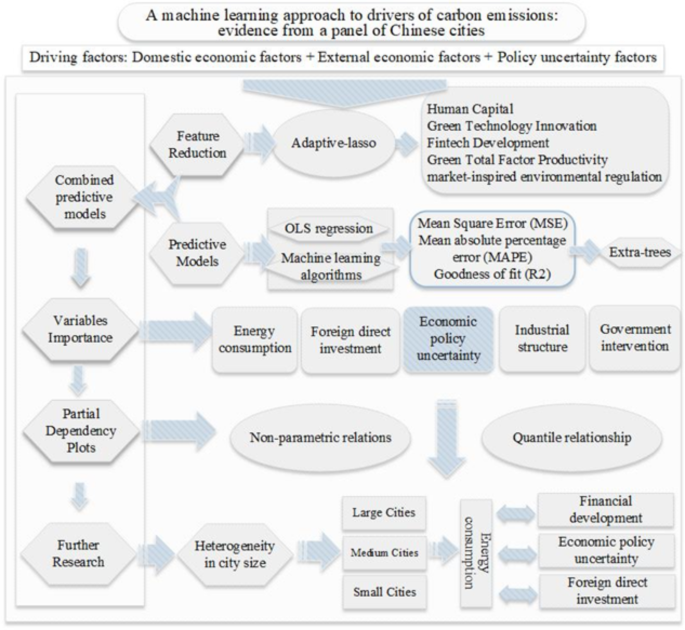
data, please refer to Appendix 1(Supplementary Table 1) in the Supplementary Information. COMBINED PREDICTION MODEL A framework for the research is shown in Fig. 1. While the literature
review section explores the many factors that existing scholars believe influence China’s carbon emissions, from internal, external and uncertainty factors. First, based on the adaptive
lasso model, the 19 influencing factors are screened, and those with low relevance to China’s carbon emissions are eliminated. Second, prediction studies are conducted on the
feature-selected dataset through a variety of machine learning models. MSE, MAPE and R2 are used to assess the out-of-sample predictive power. Third, the importance of internal, external and
uncertainty factors affecting China’s carbon emissions are ranked and assessed according to the training results of the machine learning model. Fourth, through the partial correlation
dependency diagram, the predicted results are analyzed in an interpretable way, indicating the direction and magnitude. Fifth, the heterogeneity of the influencing factors is explored at
different city sizes. FEATURE SELECTION The Lasso model adds penalty terms to the generalized linear model to realize the feature selection function. And the Adaptive-Lasso model is able to
use different penalty weights, which can better avoid model overfitting and improve the interpretability of the model, as detailed in Eq. (1): $${\hat {\beta }_{{\text{alasso}}}}=\arg
\hbox{min} (\parallel Y - X\beta {\parallel ^2}+\lambda \sum\limits_{{j=1}}^{p} {{{\hat {w}}_j}} \left| {{\beta _j}} \right|)$$ (1) Where\({\hat {w}_j}=1/{\left| {\hat {\beta }}
\right|^\gamma }\)\((\gamma \succ 0)\)is the weighting function, \(\lambda\) is the penalty parameter. The crucial for the Adaptive-Lasso model to implement variable selection is to
determine a suitable weight function\({\hat {w}_j}\), and the weights are obtained using cross-validation. The data used in this experiment was normalized based on the original data and the
feature selection process for adaptive lasso was implemented using R software. MULTIPLE MACHINE LEARNING FORECASTING MODELS This paper selects Ordinary Least Square (OLS) and six multiple
algorithms based on decision tree optimization to study the drivers of carbon emissions. They are OLS, Regression Tree (RT), Bagging, Random Forest (RF), Boosting, Xgboost, and Extremely
randomized trees (Extra-trees). The traditional OLS regression and six machine learning algorithms are described in detail in Appendix 2. Where, OLS, Regression tree, Bagging models are
implemented through R software. Random forest, Boosting, XGBoost and Extra-trees models are implemented through Python software. According to53, all six machine learning models are based on
decision tree algorithms with integrated learning. They improve the recognition rate and generalization of a single base learner by learning to obtain a decision tree base learner that
combines the predictions of all base learners. Their advantage lies in their ability to achieve predictive interpretability in terms of variable importance and biased dependency graphs,
which can better analyze the interrelationships. Due to space constraints, in addition to the Extra-trees model, the five machine learning models are described in detail in the Appendix 2,
this paper focuses on the principle of the Extra-trees model. The main steps of Extra-trees (Extreme Randomized Trees) are as follows: Step 1: Input data set \(D=\left\{
{({x_1},{y_1}),({x_2},{y_2}), \cdots ,({x_m},{y_m})} \right\}\), weak classifier iterations T and randomly selected samples from the training data; Step 2: Feature selection. For \(t=1,2,
\cdots ,T\), at each node, a portion of the features are randomly selected; Step 3: Split point selection. For each selected feature, a split point is randomly selected; Step 4: Node
splitting. Split nodes using randomly selected features and split points to create child nodes; Step 5: Tree construction. Repeat the above steps until a predefined stopping condition is
reached; Step 6: Integration of results. The prediction results of all trees are integrated according to Eq. (2), and the final model output is the arithmetic mean of the T estimated
coefficients: $$\widehat {y}=\frac{1}{n}\sum\limits_{{i=1}}^{n} {(predictions)}$$ (2) The model is very similar to the random forest model in that it consists of many decision trees. The
difference is that Extra-trees select a random threshold to split the nodes. This approach not only reduces the high variance problem of RF, but also has a fast-performing speed. When
training the model, Extra-trees select the entire dataset instead of using bootstrap samples. As a result, Extra-trees has better performance in the field of energy prediction compared to
other integrated models54. The MSE is used as the Gini coefficient of the split values of the different features. Eventually, the generated n decision trees form Extra-trees, and the model
predictions are the arithmetic mean of the estimated coefficients for each T. This research used six machine learning models, of which 70% were training sets and 30% were test sets. In
addition, the use of hyper-parameter tuning for a certain model leads to its prediction results being better than other models, the parameters of all models are set to the ideal values when
the learning rate is 0.1, and no further parameters are specifically tuned. For example, the parameters of the Extra-trees model are: n_estimators = 300 are chosen for the experiments in
this paper; max_features = n_features = 14 in the regression problem in this paper; and 10-fold cross-validation is chosen. PREDICTIVE EVALUATION INDICATORS This research uses three
validated predictors, MSE, MAPE and \({R^2}\), to evaluate the predictive performance of traditional OLS and six machine learning algorithms, which are calculated as detailed in Eqs. (3),
(4), and (5). These three methods of predictive evaluation were implemented using Python software. $$MSE=\frac{1}{n}\sum\limits_{{i=1}}^{n} {{{({y_i} - \hat {f}({x_i}))}^2}}$$ (3)
$$MAPE=\frac{1}{{\text{n}}}\sum\limits_{{i=1}}^{n} {\left| {\frac{{({y_i} - \hat {f}({x_i}))}}{{\hat {f}({x_i})}}} \right|} *100\%$$ (4) $${R^2}=1 - \frac{{\sum\limits_{{i=1}}^{n} {{{({y_i}
- \hat {f}({x_i}))}^2}} }}{{\sum\limits_{{i=1}}^{n} {{{({y_i} - \bar {f}({x_i}))}^2}} }}$$ (5) where n is the number of samples, \({y_i}\) the actual value of CE, \(\hat {f}({x_i})\)the
predicted value of CE, and \(\bar {f}({x_i})\) the mean value of CE. Higher values of MSE and MAPE indicate higher prediction errors, and higher \({R^2}\) indicates better model fitting.
VARIABLE IMPORTANCE AND PARTIAL DEPENDENCY PLOTS ANALYSIS VARIABLE IMPORTANCE Feature importance refers to ranking of the importance of each feature in predicting carbon emissions55. It is
implemented through Python software. In an ensemble containing K decision trees, \({x_j}\) is calculated as: $$Imp({x_j})=\frac{1}{K}\sum\limits_{{k=1}}^{K} {\sum\limits_{{z \in {\varphi
_k}}} {I({j_z}=j)[\frac{{{n_z}}}{N}\Delta i(z,s)]} }$$ (6) where z denotes the zth non-terminal node of the decision tree \({\varphi _k}\), \({j_z}\)the feature identifier used to split node
z, \(I()\)the indicator function, \({n_z}\) the number of samples arriving at node z, N the total number of samples, and \(\Delta i(z,s)\)the amount of Gini coefficient that decreases at
the zth node after s-splitting. PDPS To visualize the prediction results, the PDPs are used to plot the marginal effects of each influencing factor on China’s carbon emissions. It is
implemented through Python software. Since \(f( \cdot )\) has no analytic expression, it is generally difficult to compute this expectation directly. Therefore, replacing the overall mean
\({E_{{x_2}, \cdots {x_p}}}( \cdot )\) with the sample mean can be obtained: $$\hat {\phi }({x_1}) \equiv \frac{1}{n}\sum\limits_{{i=1}}^{n} {f({x_1},{x_i}_{2}, \cdots ,{x_{ip}})}$$ (7)
Arbitrarily given \({x_1}\), \(\hat {\phi }({x_1})\) can be computed and the visualization of \(({x_1},\hat {\phi }({x_1}))\)drawn as partial dependency plots. STEPS OF THE EMPIRICAL STUDY
RESULTS OF THE EMPIRICAL RESEARCH FEATURE SELECTION To avoid overfitting, the adaptive Lasso model is used to screen the 19 drivers initially and shrink the irrelevant factors and the
results are shown in Table 3. The estimated coefficients of HCL, MAR, GTFP, GTEC and FTE on CE are 0, which indicates that these variables are not key influences on carbon emissions. From
the remaining 14 variables affecting carbon emissions, we find that ENC is the variable that most affects carbon emissions, which is also uniformly considered by all scholars. In addition to
this, we note that the uncertainty factor also seems to be an important variable that affects carbon emissions and that this influence is even higher than most of the internal and external
economic factors56. also concluded that uncertainty is a major factor in the increase ofCE. COMPARISON OF PREDICTED RESULTS The adaptive lasso model can only perform the feature selection,
but it is difficult to determine the direction of the influence of each factor. Therefore, Regression tree, Bagging, Random Forest, GBM, XGBoost and extra-trees, are used in this paper for
this purpose. Before the research, it is determining the multivariate prediction model for carbon emissions through three evaluation indexes: MSE, MAPE and R2. According to the results of
Table 3 adaptive lasso shrinkage of irrelevant variables, 14 influential variables are selected, and the prediction performance of different models is evaluated. Table 4 shows three
conclusions. First, all the five machine learning algorithms selected in this paper, except the RT, demonstrate stronger prediction performance in predicting carbon emissions than the
traditional OLS model, which verifies the utilization of the machine learning algorithms. Second, although the results of these algorithms are close in value, the Extra-trees is superior by
providing the smallest MSE and MAPE values and the largest R2. This suggests that the Extra-trees is the optimal machine learning algorithm for predicting carbon emissions in China. VARIABLE
IMPORTANCE The advantage that integrated machine learning models based on decision trees have is the ability to determine the order of importance of each influencing factor in predicting
carbon emissions. The Extra-trees algorithm is carried out for variable importance analysis57, and Fig. 2 reports the importance ranking of 14 feature variables. The study found that CE is
still generated by internal production and economic activities, with energy consumption being the most influential internal factor. This result is shared by many scholars, as58 also argued
that energy consumption is the main factor leading to CE, and that a rapid increase in energy use leads to a significant increase in carbon dioxide emissions. Next, the external economic
factor of FDI is a secondary factor that affects carbon emissions and has received equal attention in carbon emissions research. Like the study of59, the main direction is to study whether
the environmental effect of FDI is a pollution paradise or a pollution halo. Most importantly, uncertainty factors also seem to be a key factor affecting carbon emissions, especially the
EPU, which suggests that EPU is also not negligible. Existing studies have examined the impact of uncertainty factors on China’s carbon emission efficiency less, and most of them still focus
on internal economic and external economic factors. PDPS ANALYSIS The Extratrees algorithm not only allows for ranking the importance of variables but also enables the exploration of the
nonparametric and quantile relationships, also known as PDPs analysis. Figures 3 and 4, and 5 visualize the marginal effects of domestic economic, external economic, and policy uncertainty
factors on China’s carbon emissions, respectively. Figure 3 presents the PDPs of nine domestic economic factors on carbon emissions. FIRST, we find that URL, UIS, AGDP, ENC, and COR have a
positive effect on CE, which is supported by the results of previous studies, such as60, who find that industrialization, economic growth, and energy consumption have a positive and
significant effect on CE in Chin61. found that command environmental regulation does not significantly affect regional carbon neutrality. SECOND, as MKD rises, it tends to reduce and
increase carbon emissions, with the most potent suppression when MKD is in the 6/10th percentile. For example62, finds that excessive marketization causes a lowering of the market entry
barrier, leading to vicious competition among enterprises. THIRD, FIN seems to be less stable, although, in the lower quantiles, it suppresses the increase63. also find it. FOURTH, GOV can
effectively curb CE, as23 find that GOV is essential in reducing CE. FIFTH, DIG significantly reduces carbon emissions in China, but the alleviating effect is not linear. Cities in the
2/10th to 5/10th deciles of the DIG have the most significant carbon mitigation effect64. also suggests that the carbon reduction effect is also weaker in cities where DIG is less developed.
Figure 4 shows the PDPs of the external economic factors. First, the increase of OPEN brings about a significant increase inCE. Although there are fewer observations in the tail region of
OPEN and the results in the tail region may not be credible, it is still important to notice the strong effect of excessive openness to the outside world on pollution in a few cities.
Second, the increase in FDI has a positive effect on CE, implying that FDI exacerbates the increase in CE. The rate of increase is more moderate in the lower quartile regions of FDI, but in
the higher quartile regions of FDI, there is a near-vertical increase. Therefore, cities with high foreign direct investment need to the problem of large increases in CE. The results of this
study also prove the “pollution paradise hypothesis”. That is, TNCs tend to transfer polluting industries or their production processes to developing countries for the sake of saving the
cost of environmental management and other factors, thus aggravating environmental pollution in the host countries. Figure 5 shows the partial dependence plot of the three major uncertainty
factors, and the analysis of the estimated coefficients reveals that EPU has the greatest impact on CE, followed by CPU and WPU. First, EPU is the most among the three major uncertainty
factors, which is also consistent with the findings of the variable importance ranking. The effect is not significant from 1/10th to 4/10th quantile of EPU, but by the 5/10th quantile, the
increase in EPU significantly reduces carbon emissions until the 7/10th quantile when this negative effect gradually slows down. And after the 7/10th quantile, EPU is again insignificant.
Second, WPU shows a sharp decline and then rebound to remain stable. At WPU quartiles 1/10 to 8/10, a “sudden stop” occurs. However, the phenomenon is short-lived, and at the 8/10 to 9/10
quantile of the WPU, carbon emissions increase rapidly to a certain level and remain stable. This suggests that WPU should be noticed as soon as it appears. Third, CPU and CE is a nonlinear
one that decreases and then increases. At the 1/10th to 6/10th quartile of CPU, it decreases CE. Subsequently in the 6/10 to 8/10 quartile, CPU is insignificant. But in the tail region, CPU
again increases carbon emissions. RESEARCH ON URBAN HETEROGENEITY The size of a city depends on its population. The performance of different city types varies65. To examine the heterogeneous
influence of the difference in urban population volume on carbon emissions in China, according to _the Notice on Adjusting the Criteria of Urban Size Classification released by the State
Council_ in 2014, we divide the cities into three categories (i.e., small-, medium- and large-sized cities) in accordance to their population, where 0.5 and 1 million are set as the
boundaries. Figure 6 reports the results of the analysis of city size heterogeneity, and we find that the most important variable affecting carbon emissions is still ENC, regardless of
small, medium and large cities. This implies that the reduction of traditional energy consumption is imminent. This requires China to increase its investment in energy transformation and
upgrading. In addition, the extent of FDI’s impact manifests itself differently in different types of cities, but it will be greater in small and medium-sized cities. Polluting firms prefer
medium-sized and small cities as pollution shelters, while large cities will pay more attention to FDI investment in R&D of cleaner production technologies and equipment. Finally, EPU is
still the strongest among the uncertainty factors, but it has different performance in different sizes of cities, with EPU being more significant in small and medium-sized areas and weaker
in large cities. On the one hand, this is inseparable from the fact that enterprises in large cities have a green development awareness and technological innovation. On the other hand,
well-developed market information disclosure, social responsibility systems and strong environmental regulation are also major contributors to the ability of large cities to withstand the
risk of uncertainty. DISCUSSIONS This experiment is conducted from three perspectives: internal, external and uncertainty. We find that the domestic economic factors of energy consumption
(ENC) and industrial structure (UIS) are the most important influencing factors. Similar to the results of many studies, the high use of traditional energy sources remains the underlying
cause, for example58. However, considering that China is increasingly affected by various external shocks as well as policy uncertainties in the context of the global economic downturn, the
extent of their contribution to carbon emissions is interesting to research. Finally, cities of different sizes need to be customized in their choice of carbon reduction measures, so
research on city-size heterogeneity is also necessary. First, the external shocks. There is no clear conclusion in the existing research on whether the impact of FDI on the environment is
the “Pollution Paradise Hypothesis” or the “Pollution Halo Hypothesis”. The experiments in this paper prove the Polluted Paradise Hypothesis. 66 and 67 argue that other countries favor FDI
to shift the industry chain that generates high pollution to China, increasing carbon emissions through scale and structural effects. However, this is contrary to68, the environmental effect
of FDI brings about a “pollution halo”. That is, the clean technology or standards adopted by TNCs will spread to local polluting enterprises, contributing to the improvement of our
environment and emphasizing FDI’s technological effect. Second, the policy uncertainty. (1) An increase in EPU significantly reduces carbon emissions. The reason is that in an environment of
high EPU, enterprises and banks are afraid to take the risk of investing for fear that it will affect the return on investment. This results in a rapid deterioration of the economic
development environment, enterprises face serious information deficiencies and business risks, significantly reducing the scale of production and investment activities. The eventual
moratorium on the use of traditional energy sources is not conducive to productive activities7. concur with this view, which results from the cost effect of EPU. However, it deviates from
the findings of69 who argued that EPU increases carbon emissions directly or indirectly through the investment channel. (2) Carbon emissions decrease rapidly at the onset of WPU, then
rebound and remain stable. As WPU is accompanied by the spread of a pandemic and fluctuates over a short period of time, the emergence of a pandemic leads to a sudden cessation of economic
activity and a sharp decrease in carbon emissions. However, this phenomenon lasts for a relatively short period of time, and as the pandemic is cured and economic activity resumes, carbon
emissions quickly rebound and level off. However, in the tail region of the WPU, there are fewer observations, so the WPU should be noticed as soon as it occurs, otherwise it can have a
significant impact8. also argued that the existence of the WUC would lead to a rapid reduction in carbon emissions due to the sudden stop in economic activity. (3) CPU and CE have a more
complex relationship. At lower levels, with the increase in CPU, pushes the economy towards cleaner production, thus reducing fossil fuel consumption. However, this substitution effect is
found to be absent in the high quantiles of CPU region as people shift to consume more fossil energy, thus rendering corporate green innovation less effective and ultimately leading to
increased carbon emissions70. also share this view. Finally, urban scale heterogeneity. (1) Foreign direct investment has a greater impact on small and medium-sized cities, probably because
the “pollution paradise hypothesis” exists mainly in small and medium-sized cities with lax environmental enforcement measures. In the face of greater environmental pressures, the state
prioritizes the optimization of the environment in large cities and reduces administrative resources for environmental enforcement in small and medium-sized cities. As a result, polluting
firms find refuge in these areas, leading to a strong impact of FDI in small and medium-sized cities71. also share this view. (2) EPU has a more significant impact in small and medium-sized
cities and a weaker impact in large cities. Large cities have a well-developed trade structure and strong confidence in residents’ consumption and business investment. EPU’s reduction in
consumption through precautionary savings and wealth effects is not evident. Enterprises can also capture investment opportunities under uncertain conditions and mitigate risks, improving
the ability of large cities to withstand uncertain risks. On the contrary, enterprises in small and medium-sized cities, whose awareness of green development responsibility and green
innovation technology are not at a high level, market information disclosure and social responsibility system still need to be improved, environmental regulation still need to be
strengthened, are more susceptible to the impact of EPU. Similarly72, argued that EPU on energy efficiency in different quartiles of urban distribution in China. CONCLUSIONS AND POLICY
RECOMMENDATIONS Many scholars have made great contributions to the field of carbon emission reduction and have identified many factors that affect carbon emissions in China. Among them,
energy consumption has been identified as the root cause of China’s high carbon emissions. Of course, a few scholars also believe that certain external investment and policy uncertainty
factors are also key factors affecting carbon emissions. However, existing studies have not uniformly included these influencing factors into the research framework for analysis. Therefore,
this paper based on adaptive lasso and multiple integrated machine learning. The key factors affecting carbon emissions in 254 Chinese cities are identified from three aspects: internal
economic factors, external economic factors and uncertainty factors. And the interpretability analysis of the prediction is carried out using variable importance and partial dependency
graph. Cities are categorized into small, medium and large according to their size and analyzed for heterogeneity. Similar to the results of most studies, e.g27. We find that energy
consumption is indeed a fundamental factor influencing China’s high carbon emissions. Foreign direct investment (FDI) and economic policy uncertainty are important external factors
influencing carbon emissions, and this influence is even higher than most internal factors. In addition, Extre-trees, an integrated machine learning model based on decision tree modeling,
has the best performance in predicting urban carbon emissions. The model has unique advantages in terms of predictive interpretability, including variable importance ranking and partial
dependency graph analysis. Our experiments affirm the contribution of traditional energy use. Furthermore, foreign direct investment (FDI) increases carbon emissions through scale and
structural effects, proving the “pollution paradise” hypothesis of environmental effects. Economic policy uncertainty can exacerbate shrinkage of firms to reduce carbon emissions through the
cost effect, which is accompanied by a decrease in economic activity and is detrimental to the country’s economic development. Finally, the heterogeneity analysis of city size reveals
energy consumption as a common driver. Besides, large-sized cities should focus on the digital transformation of traditional finance, medium-sized cities on EPU, and small-sized cities on
FDI. We provide relevant policy recommendations. First, high consumption of traditional energy sources remains the root cause of high carbon emissions. Therefore, fully develop and utilize
China’s extremely abundant wind, light, and water energy resources, accelerate the transition from traditional energy to renewable energy, realize the continuous substitution of black
energy, and make simultaneous efforts from both the demand side and the supply side in order to dramatically reduce the demand for coal consumption73. also argue that renewable energy can
alleviate the carbon emission problem in OECD. Second, China needs government departments and enterprises at all levels to introduce foreign investment of high quality and high efficiency in
a selective and targeted manner. Taking foreign environmental protection requirements as the standard, introducing advanced technologies for green production and guiding foreign investment
to expand into green research and development. Reducing the scale and structural effects and realizing the environmental effects of the FDI pollution halo by expanding the technological
effects. Third, rising EPUs and unstable economic policies reduce the dynamism of economic development and make it difficult to achieve green and sustainable development. The Chinese
government should endeavor to maintain the continuity and stability of domestic economic policies and prudently adjust economic policies. It should adopt a firmer policy stance to reduce
economic policy volatility and accelerate the optimization of corporate energy consumption structure. Fourth, it identifies differences in influencing factors at different city scales and
tailors its recommendations to the local context. In addition to direct measures to reduce energy use and accelerate energy green transformation, Large cities should fully utilize the
emission reduction effect of digital finance and pay attention to its future development, The focus is on digital transformation, emphasizing the scenario application of emerging information
technology and accelerating the deep integration of the two; Medium-sized cities should pay more attention to the ability to withstand the risk of economic policy uncertainty, enhance the
flexibility of macroeconomic policies, strengthen the coordination and linkage of policies, moderately expand effective investment, improve the institutional mechanism to promote
consumption, release the potential of domestic demand, and effectively respond to the uncertainty of economic policies with the great resilience and the certainty of sustained and healthy
development; Smaller cities need to foreign direct investment on productive carbon emissions, take the “dual-carbon” goal as a guide, make digitalization, greening and intelligence
high-quality requirements for the introduction of foreign direct investment, accelerating transformation, the green and low-carbon upgrading of foreign investment. Some limitations will
hopefully be addressed in future research. First, the experimental dataset is based on various factors studied in 254 cities in China. Then future research can go deeper into the enterprise
level and consider experiments at the micro level, which can identify supply chain risks more precisely. Second, Second, the selection of optimal parameters determines the goodness of the
predictive model, which requires parameter tuning using hyperparametric methods. So that machine learning models can be optimized from different tuning methods in future research. Finally,
more sophisticated deep learning models may have better experimental results in predicting larger datasets compared to machine learning models, such as ANN and MARS models25,74. Therefore,
experiments using neural network models could be considered in future research. DATA AVAILABILITY The datasets used and analysed during the current study available from the corresponding
author on reasonable request. ABBREVIATIONS * Extra-trees: Extremely Randomized Trees * MSE: Mean Square Error * MAPE: Mean Absolute Percentage Error * R2: Goodness of Fit * PDPs: Partial
Dependence Plots * CE: Carbon emissions * URL: Urbanization rate * MKD: Marketability * UIS: Industrial structure * HCL: Human capital levels * FIN: Financial development * GOV: Government
intervention * AGDP: Economic levels * ENC: Energy consumption * MAR: Market-inspired environmental regulation * COR: Command-based environmental regulation * GTFP: Green Total Factor
Productivity * GTEC: Green Technology * DIG: Digital finance * FTE: Fintech Development * OPEN: Opening-up * FDI: Foreign Direct Investment * EPU: Economic policy uncertainty * WPU: World
pandemic uncertainty * CPU: Climate policy uncertainty REFERENCES * Ipcc, S. R. Climate change 2022: Impacts, adaptation and vulnerability[EB/OL]. https://www.ipcc.ch/report/ar6/wg2/ * Tang,
J. X., Gong, R. Z., Wang, H. L. & Liu, Y. X.Scenario analysis of transportation carbon emissions in China based on machine learning and deep neural network models. _Environ. Res. Lett.
_18 (6), 1–13. https://doi.org/10.1088/1748-9326/acd468 (2023). Article Google Scholar * Tang, J. X., Gong, R. Z., Wang, H. L. & Liu, Y. X.Scenario analysis of transportation carbon
emissions in China based on machine learning and deep neural network models. _Environ. Res. Lett. _18 (6). https://doi.org/10.1088/1748-9326/acd468 (2023). * Zhou, W. W., Cao, X. M., Dong,
X. F. & Zhen, X. The effects of carbon-related news on carbon emissions and carbon transfer from a global perspective: evidence from an extended stirpat model. _J. Clean. Prod.
_425https://doi.org/10.1016/j.jclepro.2023.138974 (2023). * Hao, L. N., Umar, M., Khan, Z. & Ali, W. Green growth and low carbon emission in g7 countries: how critical the network of
environmental taxes, renewable energy and human capital is? _Sci. Total Environ. _752 (1), 1–10. https://doi.org/10.1016/j.scitotenv.2020.141853 (2021). Article CAS Google Scholar * Wang,
Q. & Wang, S. S. Preventing carbon emission retaliatory rebound post-covid-19 requires expanding free trade and improving energy efficiency. _Sci. Total Environ. _746 (1), 1–15.
https://doi.org/10.1016/j.scitotenv.2020.141158 (2020). Article CAS Google Scholar * Lu, H. Z., Gao, Q. J. & Li, M. Does economic policy uncertainty outperform macroeconomic factor
and financial market uncertainty in forecasting carbon emission price volatility? Evidence from China. _Appl. Econ. _54, 6427–6443. https://doi.org/10.1080/00036846.2022.2156470 (2022).
Article Google Scholar * Sikarwar, V. S., Reichert, A., Jeremias, M. & Manovic, V. Covid-19 pandemic and global carbon dioxide emissions: a first assessment. _Sci. Total Environ. _794
(1), 1–7. https://doi.org/10.1016/j.scitotenv.2021.148770 (2021). Article CAS Google Scholar * Yilanci, V. & Ursavas U.Dynamic relationship between carbon emissions and climate policy
uncertainty: a dynamic symmetric and asymmetric fourier causality analysis. _Environ. Eng. Manag. J. _22 (1), 105–124. https://doi.org/10.30638/eemj.2023.010 (2023). Article CAS Google
Scholar * Mirza, F. M. & Kanwal, A. E. Consumption, carbon emissions and economic growth in Pakistan: dynamic causality analysis. _Renew. Sustainable Energy Reviews_. 72, 1233–1240.
https://doi.org/10.1016/j.rser.2016.10.081 (2017). Article CAS Google Scholar * Xiao, Y. P. et al. D.Spatiotemporal differentiation of carbon emission efficiency and influencing factors:
from the perspective of 136 countries. _Sci. Total Environ. _879https://doi.org/10.1016/j.scitotenv.2023.163032 (2023). * Alessi, L. & Detken C.Identifying excessive credit growth and
leverage. _J. Financial Stab. _35, 215–225. https://doi.org/10.1016/j.jfs.2017.06.005 (2018). Article Google Scholar * Yu, W., Xia, L. & Cao Q.Forecasting digital economy of China
using an adaptive lasso and grey model optimized by particle swarm optimization algorithm. _J. Intell. Fuzzy Syst. _44 (2), 2543–2560. https://doi.org/10.3233/jifs-222520 (2023). Article
Google Scholar * Liu, W. D., Jiang, W. B., Tang, Z. P. & Han, M. Y.Pathways to peak carbon emissions in China by 2030: an analysis in relation to the economic growth rate. _Sci.
China-Earth Sci. _65 (6), 1057–1072. https://doi.org/10.1007/s11430-021-9901-y (2022). Article ADS Google Scholar * Zou, H. The adaptive lasso and its oracle properties. _J. Am. Stat.
Assoc. _101 (476), 1418–1429 (2006). Article MathSciNet CAS Google Scholar * Li, W., Zhang, S. & Lu C.Research on the driving factors and carbon emission reduction pathways of
China’s iron and steel industry under the vision of carbon neutrality. _J. Clean. Prod. _357 (1), 1–26. https://doi.org/10.1016/j.jclepro.2022.131990 (2022). Article CAS Google Scholar *
Guo, X. M. & Fang, C. L.How does urbanization affect energy carbon emissions under the background of carbon neutrality? _J. Environ. Manage.
_327https://doi.org/10.1016/j.jenvman.2022.116878 (2023). * Zhang, J., Wang, K. Q., Zhao, W. D., Han, Y. & Miao X.Corporate social responsibility and carbon emission intensity: is there
a marketization threshold effect? _Emerg. Markets Finance Trade _. 58 (4), 952–964. https://doi.org/10.1080/1540496x.2020.1854219 (2022). Article Google Scholar * Dong, B. et al. R.Carbon
emissions, the industrial structure and economic growth: evidence from heterogeneous industries in China. _Environ. Pollut. _262 (1), 1–12. https://doi.org/10.1016/j.envpol.2020.114322
(2020). Article CAS Google Scholar * Lo Re, M., Veglianti, E., Parente, F., Monarca, U. & Magazzino C.Economic network dynamics: a structural analysis of the international
connectivity of Chinese manufacturing firms. _J. Economic Stud. _50 (8), 1585–1600. https://doi.org/10.1108/JES-10-2022-0531 (2023). Article Google Scholar * Khan, M. Co(2)emissions and
sustainable economic development: new evidence on the role of human capital. _Sustain. Dev. _28 (5), 1279–1288. https://doi.org/10.1002/sd.2083 (2020). Article Google Scholar * Kim, D. H.,
Wu, Y. C. & Lin, S. C.Carbon dioxide emissions and the finance curse. _Energy Econ. _88https://doi.org/10.1016/j.eneco.2020.104788 (2020). * Lin, B. Q. & Huang, C. C.Analysis of
emission reduction effects of carbon trading: market mechanism or government intervention? _Sustainable Prod. Consum. _33, 28–37. https://doi.org/10.1016/j.spc.2022.06.016 (2022). Article
Google Scholar * Cai, C., Qiu, R. & Tu Y.Pulling off stable economic system adhering carbon emissions, urban development and sustainable development values. 10: 1–13 doi: (2022).
https://doi.org/10.3389/fpubh.2022.814656 * Magazzino, C., Mele, M. & Schneider N.A new artificial neural networks algorithm to analyze the nexus among logistics performance, energy
demand, and environmental degradation. _Struct. Change Econ. Dyn. _60, 315–328. https://doi.org/10.1016/j.strueco.2021.11.018 (2022). Article Google Scholar * Kartal, M. T., Magazzino, C.
& Pata, U. K.Marginal effect of electricity generation on co2 emissions: disaggregated level evidence from China by krls method and high-frequency daily data. _Energy Strategy Reviews_.
53, 101382. https://doi.org/10.1016/j.esr.2024.101382 (2024). Article Google Scholar * Magazzino, C. & Mele M.A new machine learning algorithm to explore the co2 emissions-energy
use-economic growth trilemma. _Ann. Oper. Res. _https://doi.org/10.1007/s10479-022-04787-0 (2022). Article Google Scholar * Jiang, Q. C. & Ma, X. J.Spillovers of environmental
regulation on carbon emissions network. _Technol. Forecast. Soc. Chang._169https://doi.org/10.1016/j.techfore.2021.120825 (2021). * Yang, Y. Z., Wei, X. J., Wei, J. & Gao X.Industrial
structure upgrading, green total factor productivity and carbon emissions. _Sustainability_. 14 (2). https://doi.org/10.3390/su14021009 (2022). * Habiba, U., Xinbang, C. & Anwar A.Do
green technology innovations, financial development, and renewable energy use help to curb carbon emissions? _Renew. Energy_. 193, 1082–1093. https://doi.org/10.1016/j.renene.2022.05.084
(2022). Article Google Scholar * Yuan, B. & Cao X.Do corporate social responsibility practices contribute to green innovation? The mediating role of green dynamic capability. _Technol.
Soc. _68, 101868. https://doi.org/10.1016/j.techsoc.2022.101868 (2022). Article Google Scholar * Wang, H. L. & Guo, J. G. Impacts of digital inclusive finance on co(2)emissions from a
spatial perspective: evidence from 272 cities in China. _J. Clean. Prod. _355https://doi.org/10.1016/j.jclepro.2022.131618 (2022). * Lu, Y., Guo, J. X., Ahmad, M. & Zhang, H. T.Can
sci-tech finance pilot policies reduce carbon emissions? Evidence from 252 cities in China. _Front. Environ. Sci._10https://doi.org/10.3389/fenvs.2022.933162 (2022). * Karim, A. E., Albitar,
K. & Elmarzouky M.A novel measure of corporate carbon emission disclosure, the effect of capital expenditures and corporate governance. _J. Environ. Manage. _290 (1), 1–8.
https://doi.org/10.1016/j.jenvman.2021.112581 (2021). Article CAS Google Scholar * Doğan, B., Driha, O. M., Lorente, B. & Shahzad D. U.The mitigating effects of economic complexity
and renewable energy on carbon emissions in developed countries. 29(1): 1–12 doi: (2021). https://doi.org/10.1002/sd.2125 * Sun, W. & Dong, H. Y.Measurement of provincial carbon emission
efficiency and analysis of influencing factors in China. _Environ. Sci. Pollut. Res. _https://doi.org/10.1007/s11356-022-25031-z (2022). Article Google Scholar * Li, X. L., Yuan, S. Q.,
Yu, Y. & Jiang, T. Y.Analysis of China’s heavy industry energy-related co2 emissions and its influencing factors: an input-output perspective. _Environ. Sci. Pollut. Res.
_https://doi.org/10.1007/s11356-022-24495-3 (2022). Article Google Scholar * Zhong, S., Goh, T. & Su, B. Patterns and drivers of embodied carbon intensity in international exports: the
role of trade and environmental policies. _Energy Econ. _114https://doi.org/10.1016/j.eneco.2022.106313 (2022). * Doğan, B., Balsalobre-Lorente, D. & Nasir, M. A.European commitment to
cop21 and the role of energy consumption, fdi, trade and economic complexity in sustaining economic growth. _J. Environ. Manage. _273, 111146. https://doi.org/10.1016/j.jenvman.2020.111146
(2020). Article PubMed Google Scholar * Ashena, M. & Shahpari, G. P. Uncertainty, economic activity, and carbon emissions: a nonlinear autoregressive distributed lag approach.
_Environ. Sci. Pollut. Res. _29 (34), 52233–52247. https://doi.org/10.1007/s11356-022-19432-3 (2022). Article Google Scholar * Chang, L., Chen, K. M., Saydaliev, H. B. & Faridi, M.
Z.Asymmetric impact of pandemics-related uncertainty on co2 emissions: evidence from top-10 polluted countries. _Stoch. Env. Res. Risk Assess. _36 (12), 4103–4117.
https://doi.org/10.1007/s00477-022-02248-5 (2022). Article Google Scholar * Golub, A. A. et al. J.Escaping the climate policy uncertainty trap: options contracts for redd. _Clim. Policy_.
18 (10), 1227–1234. https://doi.org/10.1080/14693062.2017.1422478 (2018). Article Google Scholar * Huang, Y. S., Shen, L. & Liu H.Grey relational analysis, principal component analysis
and forecasting of carbon emissions based on long short-term memory in China. _J. Clean. Prod. _209, 415–423. https://doi.org/10.1016/j.jclepro.2018.10.128 (2019). Article Google Scholar
* Kong, F., Song, J. B. & Yang, Z. Z.A daily carbon emission prediction model combining two-stage feature selection and optimized extreme learning machine. _Environ. Sci. Pollut. Res.
_29 (58), 87983–87997. https://doi.org/10.1007/s11356-022-21277-9 (2022). Article Google Scholar * Su, C. W., Pang, L. D., Tao, R., Shao, X. & Umar M.Renewable energy and technological
innovation: which one is the winner in promoting net-zero emissions? _Technol. Forecast. Soc. Chang. _182 (1), 1–11. https://doi.org/10.1016/j.techfore.2022.121798 (2022). Article Google
Scholar * Charles, A. & Darne O.Backcasting world trade growth using data reduction methods. _World Econ. _1 (1), 1–23. https://doi.org/10.1111/twec.13274 (2022). Article Google
Scholar * Mardani, A., Liao, H. C., Nilashi, M., Alrasheedi, M. & Cavallaro F.A multi-stage method to predict carbon dioxide emissions using dimensionality reduction, clustering, and
machine learning techniques. _J. Clean. Prod. _275https://doi.org/10.1016/j.jclepro.2020.122942 (2020). * Sun, W. & Huang, C. C.Predictions of carbon emission intensity based on factor
analysis and an improved extreme learning machine from the perspective of carbon emission efficiency. _J. Clean. Prod. _338https://doi.org/10.1016/j.jclepro.2022.130414 (2022). * Li, S. S.,
Siu, Y. W. & Zhao, G. Q.Driving factors of co2 emissions: further study based on machine learning. _Front. Environ. Sci. _9https://doi.org/10.3389/fenvs.2021.721517 (2021). * Yang, W. Y.
& Zhou, S. H.Using decision tree analysis to identify the determinants of residents’ co < sub > 2 emissions from different types of trips: A case study of guangzhou, china. _J.
Clean. Prod. _277https://doi.org/10.1016/j.jclepro.2020.124071 (2020). * Bai, F. A machine learning approach for carbon di oxide and other emissions characteristics prediction in a low
carbon biofuel-hydrogen dual fuel engine. _Fuel_. 341https://doi.org/10.1016/j.fuel.2023.127578 (2023). * Li, W., Zhang, S. H. & Lu C.Research on the driving factors and carbon emission
reduction pathways of china?S iron and steel industry under the vision of carbon neutrality. _J. Clean. Prod. _361https://doi.org/10.1016/j.jclepro.2022.132237 (2022). * Ozgur, O., Karagol,
E. T. & Ozbugday, F. C. J. 金.Machine learning approach to drivers of bank lending: evidence from an emerging economy. 7(1): 29 (2021). * Hoxha, J., Çodur, M. Y., Mustafaraj, E., Kanj, H.
& El Masri A.Prediction of transportation energy demand in türkiye using stacking ensemble models: methodology and comparative analysis. _Appl. Energy_.
350https://doi.org/10.1016/j.apenergy.2023.121765 (2023). * Li, T. S. et al. Q.Contributions of various driving factors to air pollution events: interpretability analysis from machine
learning perspective. _Environ. Int. _173https://doi.org/10.1016/j.envint.2023.107861 (2023). * Owusu, S. M., Fu, C. B. & Hu Q.Examining economic policy uncertainty’s impact on
environmental sustainability: Insights from nordic nations. _J. Clean. Prod. _449https://doi.org/10.1016/j.jclepro.2024.141688 (2024). * Shetewy, N., Shahin, A. I., Omri, A. & Dai, K.
Z.Impact of financial development and internet use on export growth: new evidence from machine learning models. _Res. Int. Bus. Finance_. 61 (1), 1–12.
https://doi.org/10.1016/j.ribaf.2022.101643 (2022). Article Google Scholar * Zhong, W. Y. et al. Y.Accurate and efficient daily carbon emission forecasting based on improved arima. _Appl.
Energy_. 376https://doi.org/10.1016/j.apenergy.2024.124232 (2024). * Massimiliano, C., Cooray, A., Kuziboev, B. & Liu J.Chinese fdi outflows and host country environment. _J. Environ.
Manage. _366https://doi.org/10.1016/j.jenvman.2024.121675 (2024). * Khan, K. & Su, C. W. Urbanization and carbon emissions: a panel threshold analysis. _Environ. Sci. Pollut. Res. _28
(20), 26073–26081. https://doi.org/10.1007/s11356-021-12443-6 (2021). Article CAS Google Scholar * Yang, Y. H., Peng, Z. W. & Tang, D. L.The impact of heterogeneous environmental
regulations on carbon neutrality in China: new evidence based on the spatial measurement model. _Energy Environ. _https://doi.org/10.1177/0958305x221140578 (2022). Article Google Scholar *
Zhang, D. Y. .Marketization, environmental regulation, and eco-friendly productivity: a malmquist-luenberger index for pollution emissions of large Chinese firms. _J. Asian Econ.
_76https://doi.org/10.1016/j.asieco.2021.101342 (2021). * Amin, A., Dogan, E. & Khan Z.The impacts of different proxies for financialization on carbon emissions in top-ten emitter
countries. _Sci. Total Environ. _740https://doi.org/10.1016/j.scitotenv.2020.140127 (2020). * Zhang, M. L. & Liu Y.Influence of digital finance and green technology innovation on China’s
carbon emission efficiency: empirical analysis based on spatial metrology. _Sci. Total Environ. _838 (1), 1–15. https://doi.org/10.1016/j.scitotenv.2022.156463 (2022). Article CAS Google
Scholar * Xu, L., Fan, M. T., Yang, L. L. & Shao, S. Heterogeneous green innovations and carbon emission performance: Evidence at china’s city level. _Energy Econ.
_99https://doi.org/10.1016/j.eneco.2021.105269 (2021). * Singhania, M. & Saini N.Demystifying pollution haven hypothesis: role of fdi. _J. Bus. Res. _123, 516–528.
https://doi.org/10.1016/j.jbusres.2020.10.007 (2021). Article PubMed Google Scholar * Dogan, B., Balsalobre-Lorente, D. & Nasir, M. A.European commitment to cop21 and the role of
energy consumption, fdi, trade and economic complexity in sustaining economic growth. _J. Environ. Manage. _273https://doi.org/10.1016/j.jenvman.2020.111146 (2020). * Khan, S., Yuan, H. P.,
Yahong, W. & Ahmad, F. Environmental implications of technology-driven energy deficit and urbanization: insights from the environmental kuznets and pollution hypothesis. _Environ.
Technol. Innov. _34https://doi.org/10.1016/j.eti.2024.103554 (2024). * Mushtaq, M. et al. S.How does economic policy uncertainty impact co2 emissions? Investigating investment’s role across
22 economies (1997–2021). _Energy Rep. _11, 5083–5091. https://doi.org/10.1016/j.egyr.2024.04.069 (2024). Article Google Scholar * Shang, Y. F., Han, D., Gozgor, G., Mahalik, M. K. &
Sahoo, B. K.The impact of climate policy uncertainty on renewable and non-renewable energy demand in the United States. _Renew. Energy_. 197, 654–667.
https://doi.org/10.1016/j.renene.2022.07.159 (2022). Article Google Scholar * Zhang, C., Tao, R., Yue, Z. H. & Su, F. B.Regional competition, rural pollution haven and environmental
injustice in China. _Ecol. Econ. _204https://doi.org/10.1016/j.ecolecon.2022.107669 (2023). * Wei, W., Hu, H. Q. & Chang, C. P.Why the same degree of economic policy uncertainty can
produce different outcomes in energy efficiency? New evidence from China. _Struct. Change Econ. Dyn. _60, 467–481. https://doi.org/10.1016/j.strueco.2022.01.001 (2022). Article Google
Scholar * Dogan, B., Driha, O. M., Lorente, D. B. & Shahzad U.The mitigating effects of economic complexity and renewable energy on carbon emissions in developed countries. _Sustain.
Dev. _29 (1), 1–12. https://doi.org/10.1002/sd.2125 (2021). Article Google Scholar * Cartwright, H. M.Artificial neural networks, (3rd edn.)[M].in (eds),In the methods in molecular biology
series,New York:Springer,2021. Download references ACKNOWLEDGEMENTS 2022 Anhui Provincial Research Preparation Program Project(Grant No. 2022AH050558). AUTHOR INFORMATION AUTHORS AND
AFFILIATIONS * School of Finance, Anhui University of Finance and Economics, Bengbu, 233030, China Wenmei Yu, Lina Xia & Qiang Cao Authors * Wenmei Yu View author publications You can
also search for this author inPubMed Google Scholar * Lina Xia View author publications You can also search for this author inPubMed Google Scholar * Qiang Cao View author publications You
can also search for this author inPubMed Google Scholar CONTRIBUTIONS Q.C. and L.N.X. wrote the main manuscript text. W.M. Y. provides a framework for the full text and guidance on the
empirical methodology. All authors reviewed the manuscript. CORRESPONDING AUTHOR Correspondence to Qiang Cao. ETHICS DECLARATIONS COMPETING INTERESTS The authors declare no competing
interests. ADDITIONAL INFORMATION PUBLISHER’S NOTE Springer Nature remains neutral with regard to jurisdictional claims in published maps and institutional affiliations. ELECTRONIC
SUPPLEMENTARY MATERIAL Below is the link to the electronic supplementary material. SUPPLEMENTARY MATERIAL 1 RIGHTS AND PERMISSIONS OPEN ACCESS This article is licensed under a Creative
Commons Attribution 4.0 International License, which permits use, sharing, adaptation, distribution and reproduction in any medium or format, as long as you give appropriate credit to the
original author(s) and the source, provide a link to the Creative Commons licence, and indicate if changes were made. The images or other third party material in this article are included in
the article’s Creative Commons licence, unless indicated otherwise in a credit line to the material. If material is not included in the article’s Creative Commons licence and your intended
use is not permitted by statutory regulation or exceeds the permitted use, you will need to obtain permission directly from the copyright holder. To view a copy of this licence, visit
http://creativecommons.org/licenses/by/4.0/. Reprints and permissions ABOUT THIS ARTICLE CITE THIS ARTICLE Yu, W., Xia, L. & Cao, Q. A machine learning algorithm to explore the drivers
of carbon emissions in Chinese cities. _Sci Rep_ 14, 23609 (2024). https://doi.org/10.1038/s41598-024-75753-y Download citation * Received: 21 June 2024 * Accepted: 08 October 2024 *
Published: 09 October 2024 * DOI: https://doi.org/10.1038/s41598-024-75753-y SHARE THIS ARTICLE Anyone you share the following link with will be able to read this content: Get shareable link
Sorry, a shareable link is not currently available for this article. Copy to clipboard Provided by the Springer Nature SharedIt content-sharing initiative KEYWORDS * Carbon emissions *
Machine learning * Extremely randomized trees * Partial dependence plots * City heterogeneity