Impact scenarios on groundwater availability of southern italy by joint application of regional climate models (rcms) and meteorological time series
- Select a language for the TTS:
- UK English Female
- UK English Male
- US English Female
- US English Male
- Australian Female
- Australian Male
- Language selected: (auto detect) - EN
Play all audios:
ABSTRACT Nowadays the phenomenon of global warming is unequivocal, as confirmed by the latest reports of the IPCC and studies of the climate-change impacts on ecosystems, global economy, and
populations. The effect of climate change on groundwater is a very relevant task especially for regions dependent chiefly on groundwater availability, as for the southern Italy. In such a
territorial framework, to achieve a detailed hydro-climatological characterization, an Ensemble of 15 RCMs (E15) derived from the EURO-CORDEX project was analyzed considering two IPCC
Representative Concentration Pathways (RCP4.5 and RCP8.5). The E15 was calibrated over the period (1950–1996) by a statistical comparison with data observed by the regional meteorological
network managed by the former National Hydrological Service (SIMN), Department of Naples. The effects of climate change on air temperature (T), precipitation (P) and, consequently, on actual
evapotranspiration (ETR) and effective precipitation Pe (P – ETR) were analyzed until 2100. The latter was considered as a proxy of groundwater recharge of the principal aquifer systems,
represented chiefly by the karst aquifers. As a principal result, it was found that the E15 is basically able to reproduce the observed annual precipitation (OBSP) and mean annual air
temperature (OBST), being characterized by a very similar frequency distribution. Accordingly, an inferential statistical approach was performed for calibrating E15 precipitation (E15P) and
air temperature (E15T) based on the compensation of the difference with OBSP (+ 7%) and OBST (− 16%). The E15 projects a reduction in precipitation and an increase in air temperature under
both RCPs, with a divergence point between the two scenarios occurring by about 2040. As a principal result, Pe shows declining trends for both RCP scenarios, reaching a decrease of the
11-yrs moving average down to − 20%, for RCP4.5, and − 50%, for RCP8.5, even if characterized by relevant inter-annual fluctuations. SIMILAR CONTENT BEING VIEWED BY OTHERS CHANGES IN THE
HYDRO-CLIMATIC REGIME OF THE HUNZA BASIN IN THE UPPER INDUS UNDER CMIP6 CLIMATE CHANGE PROJECTIONS Article Open access 12 December 2022 RECENT AND PROJECTED PRECIPITATION AND TEMPERATURE
CHANGES IN THE GRAND CANYON AREA WITH IMPLICATIONS FOR GROUNDWATER RESOURCES Article Open access 12 November 2020 STATISTICAL DOWNSCALING OF GRACE TERRESTRIAL WATER STORAGE CHANGES BASED ON
THE AUSTRALIAN WATER OUTLOOK MODEL Article Open access 02 May 2024 INTRODUCTION The economic and social development of southern Italy is fundamentally sustained by the availability of
groundwater resources, which are provided by a series of principal aquifers. Among these aquifers, the karst ones are the most significant due to their high mean annual groundwater yield,
which is the highest in Europe1. In such a framework, the study of the future effects of climate change on groundwater recharge and availability is a very relevant task. Precipitation and
air temperature represent the key variables controlling groundwater recharge processes and the most susceptible to the effects of climate change. As highlighted by various researches, the
effects of climate change will substantially disrupt the water cycle, leading to an increase in the air temperature and in the intensity and frequency of extreme hydro-climatic events in
numerous regions worldwide2,3,4,5. The Mediterranean region, where Italy occupies the central part, is acknowledged as one of the major climate change hotspots due to future projections of
air temperature increase and annual precipitation decrease6,7,8. One of the most recognized approaches for the development of future climate projections is based on the usage of regional
climate models (RCMs) under different greenhouse gas emission scenarios9. Despite the important relationship between climate patterns and groundwater resources10, researches have not
advanced yet the analysis of the future impacts of climate change on groundwater recharge processes to the same extent of those carried out on surface water resources11. Consequently, the
analysis of future hydrogeological scenarios, depending on long-term patterns of precipitation and air temperature, appears as a fundamental achievement for a resilient management of
groundwater resources in southern Italy, where the economic development is mainly reliant on groundwater resources and studies regarding the impacts of climate change are still scarce.
Accordingly, this study aims to analyse the effects of the climate change on the groundwater recharge processes of the major aquifers systems of the southern Italy, by the application of
data of 15 RCMs provided by the European Coordinated Regional Downscaling Experiment (EURO-CORDEX)7, which are currently used to project scenarios of precipitation (P) and air temperature
(T) until the end of the XXI century. Moreover, in this study we propose a novel and practical method for the evaluation and correction of different RCMs’ data against observed historic
meteorological time series (1950–1996) over southern Italy, which is based on an inferential statistical approach. The estimation of expected changes in annual values of actual
evapotranspiration (ETR) and effective precipitation (Pe) until 2100 was obtained by considering an ensemble mean of 15 RCMs (E15) under two representative concentration pathways scenarios,
respectively IPCC RCP 4.5 and RCP 8.55,12. The proposed approach of the bias correction of RCMs is performed at the annual time-scale, and is based on the comparison at the regional scale
with time series recorded by a national meteorological network, which functioned discontinuously in space and time. To the best of our knowledge, the outcomes of the present research provide
a relevant contribution for the first time in the assessment of groundwater resources availability under future water crisis scenarios in southern Italy. The results of the analyses are
addressed primarily to the karst aquifers, which represent the most important sources of groundwater for the region, but secondarily also to the others minor aquifers which represent local
relevant groundwater resources. RCMS IN THE MEDITERRANEAN AREA General circulation models (GCMs) and RCMs are applied worldwide at different spatial resolutions and temporal scales, for the
development of climate scenarios up to the end of the current century. A series of international projects and studies (e.g. CORDEX7) have produced a huge ensemble of climate projections,
accounting for most of the uncertainties affecting climate change predictions13. At the resolution of GCMs Italy is not well delineated, since it has a complex topography, ranging from high
mountain chains to a diverse coastline. For this reason, data from high-resolution RCMs have been considered in the present research. Specifically, Holman14 suggested that the best practice
for using climate projections to assess the impact on groundwater resources was to consider multiple RCMs driven by multiple GCMs under different emission scenarios (pathways). This approach
introduces additional variability in the climate data, which enhances uncertainty in the assessment of future groundwater recharge15. As first step, the state of art of RCMs simulations
(and related driving GCMs) available in the framework of Mediterranean karst aquifers has been investigated. It is summarized in Table 1, where a list of GCMs/RCMs combination is shown,
along with relevant information (e.g. spatial and temporal resolution of the models scenarios). Some of the RCMs applied derive from ENSEMBLES and PRUDENCE projects, under the A1B scenario,
defined by IPCC in the Special Report on Emissions Scenarios (SRES)24.Other RCMs applied derive from the EURO-CORDEX project25. The EURO-CORDEX team performed a dynamical downscaling of the
global simulations from the Coupled Model Intercomparison Project Phase 5 (CMIP5) long-term experiments. They are based on greenhouse gas scenarios (representative concentration pathways,
RCPs) corresponding to stabilization of radiative forcing after the twenty-first century at 4.5 W/m2 (RCP4.5), rising radiative forcing crossing 8.5 W/m2 at the end of twenty-first century
(RCP8.5), and peaking radiative forcing within the twenty-first century at 3.0 W/m2 and declining afterwards (RCP2.6)26. Precipitation and air temperature are the fundamental environmental
variables controlling climate and groundwater recharge processes, whose time series, simulated by the RCMs, are easily and largely applicable for the quantification of the groundwater
recharge by empirical and numerical models. Ensembles of different GCMs/RCMs are recognized as a suitable approach for reducing the uncertainty of the results given by a single model27,28.
For the same scope, temporal analyses are carried out at various time scales for a better assessment. Statistical downscaling techniques can increase further the spatial resolution of
climate data up to the local scale, while a range of bias correction methods28,29 have been developed to overcome the large biases in climate models, and can be used also for the
quantification of the groundwater recharge through empirical models or water budget approach. DATA AND METHODS STUDY AREA DESCRIPTION The territory of southern Italy is characterized by a
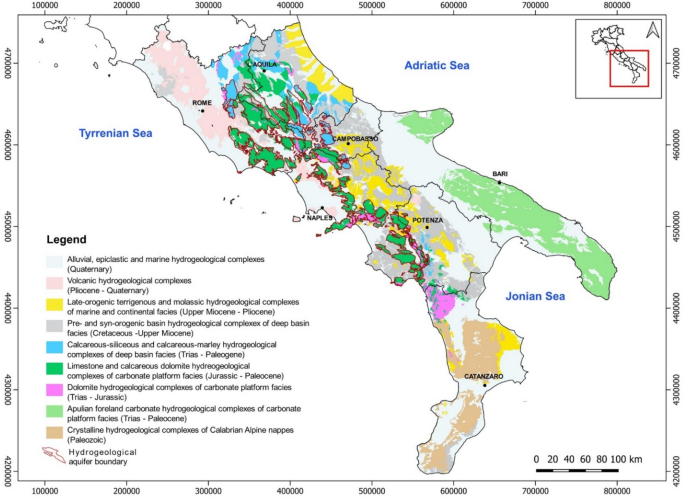
high heterogeneity and complexity of geological-structural and hydrogeological features. The principal hydrogeological features of the southern Italy can be summarized in nine
hydrogeological domains30 which, in decreasing order of relevance for what regards the mean annual specific groundwater yield (Fig. 1), can be identified as: (a) Mesozoic carbonate series
that, depending on hydrogeological features, can be arranged in four subgroups: calcareous-siliceous, limestone, dolomitic, carbonate and Apulian foreland carbonate aquifers; (b)
Plio-Quaternary alluvial and epiclastic deposits; (c) volcanic rocks and soils of Plio-Quaternary eruptive centres; (d) Paleozoic crystalline-metamorphic rocks of the Calabrian arch; (e)
Cretaceous-Cenozoic basin series, which mainly constitute the minor mountainous or hilly reliefs of the southern Apennines. In such interregional framework, the study area includes the
entire portion of the western sector of the southern Apennines (about 19,339 km2), where Mesozoic carbonate series, forming high mountain ranges, outcrop and constitute very extended karst
aquifers characterized by high permeability due to fracturing and karst phenomena (Fig. 1). These karst aquifers are characterized by limestone, limestone-dolomite and dolomite rocks,
ranging in age from Triassic to Upper Cretaceous, derived from the tectonic disintegration of the carbonate platform that occurred during the Miocene tectonic phases31,32. In southern Italy,
karst aquifers cover the 45%33 of the territory hosting the major groundwater resources which supply drinkable, industrial and thermos-mineral uses as well as contributing to the
equilibrium of river ecosystems. This is favoured by the peculiar geological-structural, hydrogeological, geomorphological and climatological settings of the region which determine the
occurrence of several high-permeability karst aquifers, with a high mean annual groundwater recharge and circulation rates. Given their importance, many studies have been carried out on the
karst aquifers of southern Italy regarding: (i) hydrogeological characterization and the mapping of groundwater resources30,34,35; (ii) groundwater recharge estimation at the different
spatio-temporal scales and by terrestrial and satellite datasets33,36,37,38; (iii) groundwater vulnerability to pollution39,40, microbial contamination and environmental impact of cattle
grazing on karst groundwater41. The Plio-Quaternary deposits, which include deposits of alluvial plains, coastal plains and intermontane basins, outcropping for about 24,500 km2, which are
directly recharged by effective or secondary infiltration from watercourses, thus receiving lateral groundwater inflow from the adjoining karst aquifer systems. The lateral confinement of
karst aquifers by low-permeability terrains constrains the groundwater circulation toward huge basal springs which are often characterized by high flows up to a few m3/s34,42,43, and
predisposed to the effective tapping. Therefore, karst aquifers represent the main source of groundwater for southern Italy, providing an estimated average annual water volume of
approximately 4100 × 106 m3 · year–1 with a mean specific annual groundwater yield up to 0.035 m3 · s–1 · km–2.30 The principal regional aqueducts are supplied by the tapping by gravity of
the main basal springs of karst aquifers, in most cases not provided by pumping systems, therefore the availability of groundwater resources of these aquifers correspond to their natural
recharge. CLIMATE MODELS To investigate the future climate projections and the related impacts on groundwater recharge processes over the study area (Fig. 2), annual precipitation and mean
air temperature data from the EURO-CORDEX simulations25 were achieved from the nodes of the earth system grid federation (ESGF). Specifically, 15 different combinations of GCMs/RCMs were
selected (Table 2). RCMs selected belong to the subset EUR-11 with a resolution of 0.11° (about 12.5 km) (Fig. 2b). Accordingly, data available for the “historical experiment” period (from
1950/1970 to 2005) and scenarios (from 2006 to 2099/2100) were analysed in this research. As already mentioned, RCP4.5 and RCP8.5 scenarios were selected, being the RCP8.5 the most severe
(“business as usual”), while the RCP4.5 is representative of intermediate conditions. According to other studies developed with a general purpose and in different geographical
frameworks44,45,46,47,48, the RCP 8.5 is commonly used because representing the most extreme conditions, even if being the least likely49. As a result, an ensemble of 15 RCMS (E15; Table 2)
was reconstructed, re-projected in WGS84-UTM 33N and analysed. OBSERVED PRECIPITATION AND AIR TEMPERATURE TIME SERIES (1950–1996) In the southern Italy, as well as for the rest of the
national territory, a hydrological monitoring has been carried out since 1921 by means of a dense monitoring network, managed by the SIMN governmental agency and consisting in a numerous
series of rain gauges and air temperature stations. In the study area, the management of the monitoring network was in charge of the Department of Naples of the SIMN, which operated in a
territory covering a large part of southern Italy, comprising the study area (Fig. 2a). The meteorological monitoring network was provided initially by mechanical rain gauges, based on the
accumulation of the daily rainfall, and air temperature stations. Starting from 1921, the number of rain gauges and air temperature stations was progressively increased and improved
technologically until reaching a total of 423 stations in 1999. The recorded data, after a process of validation, were published in the annals by the aggregation of data from daily, to
monthly and annual temporal scales. The meteorological network undergone different changes during the period 1921–1999 due to the progressive increase of the number of stations as well as
their discontinuous activity, because of temporary malfunctioning or abandonment during the World War II as well their relocation. These continuous changes of the monitoring network resulted
in time series discontinuous in space and time. Notwithstanding these issues, the huge database of historical meteorological data was considered very relevant for the comparison with RCMs
data of the “historical experiments” periods (from 1950/1970 to 2005) and innovative for the regional scale of analysis, instead of the more common site-specific one, as well as challenging
for its discontinuous functioning in space and time. Therefore, annual precipitation and mean annual air temperature were extracted by the annals of the SIMN, made of public access by a
dedicated project of Italian Institute for Environmental Protection and Research (ISPRA), and filed in a database covering the period 1950–1996. In detail, annual precipitation and mean
annual air temperature data were extracted for each of the available monitoring stations, which were considered as observation points (OBS). The OBS data were used for a statistical
comparison to the E15 ones at the regional scale, by considering both types of data comprised in each of the grid cells of the RCMs (~ 12 km) (Fig. 2a and b). A total of 143 RCMs grid cells
were recognized comprising rain gauge stations, while 96 air temperature stations. In order to represent the spatial and temporal variability of rain gauge and air temperature stations
comprised in the cells of the RCMs, a representation in the form of heat map was carried out respectively (Figs. 3 and 4). By the analysis of spatial and temporal distribution of rain gauges
in the grid cells of RCMs (Fig. 2b) a minimum number of 100 functioning rain gauges in 1951 and 1991 and a maximum of 225 in 1978 was recognized (Fig. 3). The coverage of each grid cell of
RCMs with at the least one rain gauge, up to six, prevails on cells with no rain gauges. Regarding the spatial and temporal distribution of air temperature stations in the grid cells of RCMs
(Fig. 4), the minimum number of 20 occurred in 1950 and a maximum of 96 in 1985. The coverage of each cell with no air temperature stations prevails on those comprising at least one. The
latter were recognized encompassing up to four air temperature stations for each grid cell. The lower spatial density of air temperature stations in comparison to that of rain gauges is due
to the lower spatial variability of the air temperature which is mostly controlled by the altitude only. RCMS PROCESSING: BIAS ASSESSMENT AND CORRECTION All the RCMS data (precipitation and
air temperature) were pre-processed with the climate data operators (CDO) software50, which is a collection of operators and tools for standard processing of climate and forecast model data
in NetCDF format. The operators include arithmetic functions, data selection and subsampling tools and spatial interpolation. For each model, the pre-processing has involved the aggregation
of the NetCDF datasets and the conversion of the units of precipitation (from kg·m2·s–1 to mm·h–1) and air temperature (from K to °C). Furthermore, the precipitation and air temperature data
from RCMs (based on a 360-day calendar) were adjusted by linear interpolation to align with the standard Gregorian calendar. Therefore, a subset of data related to the area of the southern
Apennines was extracted (Fig. 2b). RCMs data need the application of a bias correction technique, aimed to the removal of systematic errors. Which is performed considering a period in which
observed (OBS) and modelled time series are available and overlapped9. Different methodologies for the bias correction have been developed and are available in literature28, depending on the
choice of the method on both the type of the observed data available and the goal of the study9. Bias-correction methods require daily or monthly time-series over a period of at least 30
years51. The purpose of this stage of data processing was to assess the differences existing between the RCMS “historical experiments” datasets and the measured data (OBS) in the considered
period (1950–1996). Data elaboration was performed with the high-level functions NetCDF Library Package of MATLAB® (R2021b) applicable for reading and processing climate variables from
NetCDF data files. Specifically, a method based on inferential statistical studies of the bias was adopted. In order to allow the comparison between the E15 and OBS data, two pairs of
datasets were created, based on the recognition of grid cells of the RCM model within which OBS precipitation (OBSP) and OBS air temperature (OBST) resulted available (Fig. 5a and b). For
each year, OBSP and OBST given at each grid cell were compared with the E15 precipitation (E15P) and air temperature (E15T) data related to the same grid cell (Fig. 5a and b). In the case of
multiple stations occurring in the same grid cell, mean values of OBSP and OBST were calculated and compared with the corresponding E15P and E15T data. The _bias_ analysis between E15P and
OBSP and between E15T and OBST was carried for every grid cell at the annual scale by the equation Eq. (1):
$${Bias}_{P,T,t}\left(j\right)=\frac{({Model}_{P,T,t}\left(j\right)-{OBS}_{P,T,t}\left(j\right))}{{OBS}_{P,T,t}(j)} ,$$ (1) where \({Model}_{P,T,t}(j)\) is the value of E15P or E15T and
\({OBS}_{P,T,t}(j)\) is the observed value of precipitation or air temperature for the year _t_ (_t_ = 1950, 1951…1996) in the _jth_ grid cell. Then, the mean value of the bias over the
generic _t__year_ (\(\overline{{Bias }_{P,T,t}}\)) and the whole area, was calculated by Eq. (2): $$\overline{{Bias }_{P,T,t}}=\frac{{\sum }_{j=1}^{n}{Bias}_{P,T}(j)}{{\sum }_{j=1}^{n}j},$$
(2) In which n indicates the number of grid cells considered. Finally, the bias-corrected annual value of the E15 (\({Model}_{P,T,t}^{*}(j)\)) is then evaluated by Eq. (3):
$${Model}_{P,T,t}^{*}\left(j\right)={Model}_{P,T,t}\left(j\right) \times \left(1-\overline{{Bias }_{P,T}} \right).$$ (3) HYDRO-CLIMATOLOGICAL SCENARIOS The evaluation of the long-term
effects of climate change on hydrological variables controlling groundwater recharge of karst aquifers was carried out considering the E15 bias-corrected values of precipitation and air
temperature. Among the different hydrogeological domains, the spatial analyses were carried out on the areas of karst aquifers (Fig. 2a and b), which were considered the most relevant for
the assessment of the impact of climate change on groundwater recharge due to their hydrogeological relevance. Accordingly, all the E15 grid cells intersecting the boundaries of the karst
aquifers were extracted from the whole E15 dataset, and time series of mean annual precipitation and air temperature were created for reconstructing a complete time series including both the
“historical experiment” period (1950–2005) and scenarios (2006–2100) under both the RCP4.5 and RCP8.5 pathways. The evaluation of the climate change impact on groundwater recharge was
assessed through the application of the hydrological budget equation Eq. (4): $${P}_{tj}={ETR}_{tj}+{Ie}_{tj}+{R}_{tj},$$ (4) where \({P}_{tj}\) is the precipitation, \({ETR}_{tj}\) is the
actual evapotranspiration, \({Ie}_{tj}\) is the effective infiltration or groundwater recharge and \({R}_{tj}\) is the runoff, respectively related to the t_year_ and j_cell_. The ETR was
estimated by the Turc empirical formula52,53 Eq. (5): $${ETR}_{t,j}= \frac{{P}_{t,j}}{\sqrt{0.9+{\left(\frac{{P}_{t,j}}{300+25*{T}_{t,j}+0.05*{T}_{t,j}^{3}}\right)}^{2}}},$$ (5) where
\({P}_{t,j}\) is the total annual precipitation (mm) and \({T}_{t,j}\) is the mean annual air temperature (°C), both for the j_cell_. The Turc formula is commonly considered applicable to
all different climates, either humid, arid, hot or cold because it was reconstructed by the application of the water balance equation to precipitation and runoff data of 254 drainage basins
of Europe, Africa, America and the East Indies. In addition, the applicability of the Turc formula to the climate conditions of southern Italy has already been positively tested through a
comparison with the results obtained by the other empirical formulas of Coutagne54 and Thorntwaite55 as well as with MODIS satellite estimations33. Since the Turc formula depends on the
annual precipitation (P) and mean annual air temperature (T), it intrinsically incorporates the spatial heterogeneity of these two hydrological variables. Therefore, the formula was applied
to all grid cells for which P and T data were reconstructed by the E15 for each year of the time series. From Eqs. (4) and (5), the effective precipitation \({Pe}_{t,j}\) of the t_year_ and
j_cell_ was considered as a proxy hydrological parameter describing the amount of precipitation potentially available groundwater recharge process and, therefore, useful for assessing the
related effects of climate change scenarios Eq. (6): $${Pe}_{tj}={P}_{tj}-{ETR}_{tj}=+{Ie}_{tj}+{R}_{tj}.$$ (6) The reconstruction of Pe time series until 2100 is considered a fundamental
step to assess the groundwater recharge by the application of empirical approach based on the multiplication by a factor known as Annual Groundwater Recharge Coefficient – AGRC37, which is
suitable at the annual and regional scales. Finally, to investigate the variation of Pe relatively to the “historical experiment” period (1950–2005), the mean annual effective precipitation
index (MAEPI)56 was calculated for each year of the time series and the whole area, as follows Eq. (7): $${MAEPI}_{t}=\frac{{Pe}_{t}- {Pe Hist}_{t}}{{Pe Hist}_{t}},$$ (7) where MAEPI_t_ is
the Mean Annual Effective Precipitation Index for the t_year_ (%), Pe_t_ is the Effective Precipitation for the t_year_ and PeHist_t_ is the Mean Annual Effective Precipitation of the whole
E15 time series, corresponding to the “historical experiment” period (1950–2005), and the whole area. RESULTS RCMS BIAS ASSESSMENT The bias assessment in the Calibration period (1950–1996),
based on an inferential statistic approach, led to the quantification of RCMs accuracy in terms of precipitation and air temperature of the single RCMs considered (Table 2) against
corresponding OBS, as well as between E15P and E15T and the OBSP and OBST, respectively. In detail, a total of 143 RCMS grid cells were extracted for precipitation (Fig. 5a) and 96 for air
temperature (Fig. 5b), considering in both cases only grid cells comprising monitoring stations. Table 3 shows RCMs bias values (mean, median and standard deviation) against the observed
data for annual total precipitation and mean air temperature, averaged over the relative reference period. Figures 6 and 7 show the box plot representing the frequency distribution
respectively of mean annual air temperature and precipitation of the 15 RCMs (before correction), the E15 and OBS. Although model values of single RCMs sometimes differ significantly from
the corresponding OBS, a good accurate matching was found considering E15 values (Tables 4 and 5). In detail, the comparison of single RCMs with OBS reveals that HIRHAM5 and RCA4 showed the
highest bias, while CCLM4-8-17 and RACMO22E the best accuracy. Figure 8 shows the frequency distributions of OBS and E15 (before and after the correction). Both E15P and OBSP were found
statistically distributed with a log-normal model, showing an overestimation of E15P of about 7%. Conversely, air temperatures values of individual RCMs were recognized lower than the
corresponding OBS values (Fig. 7), showing also a quite different statistical distribution for all RCMS. The E15T values are generally 2 °C lower than OBST, and associated with the
systematic errors of the RCMs. These air temperature biases were also observed in preceding studies carried out over the same region45,57 and could be due to an inadequate representation of
complex orographic areas and a wrong evaluation of the net incoming short wave radiation. Specifically, by comparing E15T and OBST, it was observed that in both cases the values assume a
normal distribution (Fig. 8a) but that E15T underestimates observed data by about 16%. RCM BIAS-CORRECTION To investigate the future effects of climate change on groundwater recharge of the
principal aquifer systems of southern Italy, the E15P and E15T were bias-corrected according to the Eq. (2) and using the results obtained with the bias inferential statistical analysis
(Tables 4 and 5). The application of the corrections leads to a significant bias reduction, being the corrected E15P overestimation of about 0.4% (Fig. 8b and c) and the corrected E15T
underestimation of about 2.4% (Table 5) (Fig. 8b and c). HYDRO-CLIMATOLOGICAL SCENARIOS (2006–2100) The annual corrected values of E15P and E15T were used to reconstruct a continuous time
series until 2100, for both RCP4.5 and RCP8.5 scenarios, over the entire domain of the karst aquifers of southern Italy (Fig. 9). Precipitation projections show a decreasing trend under both
pathways, with strong interannual variations and rates especially under the RCP8.5 (Fig. 10a). Both scenarios project a relevant increase in air temperature, in particular the RCP8.5 shows
the largest increase of the mean value up to about 4 °C at the end of the century (Fig. 10b) while the RCP4.5 projects an increase up to 2 °C of the mean value. The differences between
scenarios are clearly recognizable from 2040, where a divergence in the trends of the time series occurs. For E15P and E15T time series under both scenarios, a confidence interval (error)
was reconstructed considering the value of the standard deviation of the bias estimated respectively in comparison to OBSP and OBST, thus corresponding to a probability interval of 68.27%.
The E15P and E15T time series of both pathways were applied for quantifying the scenarios of ETR and Pe. According to the general increase in air temperature, scenarios of ETR (2006–2110)
reveals a progressive rise for both RCP pathways (Fig. 11a). As a first result, Pe time series show a marked decreasing trend for both RCP8.5 and RCP4.5 pathways, with the most severe
condition for the RCP8.5 one (Fig. 11b). This is clearly confirmed by the comparison of the cumulative frequency distribution (%) of Pe time series in the “historical experiment” period
(1950–2005) and Pe time series of scenarios from 2045 to 2100 of both pathways (Fig. 12a); in detail, it is possible to assess that the median values (frequency of 50%) amount to 510 mm for
the “historical experiment” period (1950–2005), and to 415 mm and 320 mm for RCP4.5 and RCP8.5 pathways (2006–2100), respectively. The trend of MAEPI shows a quite stable decadal trend in
the “historical experiment” period (1950–2005), whose global average is about 538.8 mm (Fig. 12b), while relevant decreasing trends for the long-trend projections (2006–2100) of both
pathways scenarios indicating a decrease of the 11-yrs moving average down to − 20% for RPC 4.5 and − 50% for RPC 8.5. In detail, the projected time series of both pathways show (starting
from 2040) for the RPC 4.5 a stabilisation of the MAEPI 11-yrs moving average around a value 20% lower than the average of the “historical experiment” period (538.8 mm), and an enhancement
of the decreasing trend for the RPC 8.5. Moreover, remarkable annual and complexly cyclical fluctuations around the 11-yrs moving average of Pe were observed within the “historical
experiment” period (1950–2005) and scenarios (2006–2100) periods time series (Fig. 12b). In comparison to the Pe mean value of the whole “historical experiment” period (538.8 mm), MAEPI
ranges in the “historical experiment” period from a minimum − 23.4% (1965) to a maximum + 30.47% (1980). Moreover, MAEPI showed two pluriannual phases with values above the mean value of the
whole “historical experiment” period (1950–2005), corresponding respectively to periods 1955–1959 and 1971–1981, and two phases below this mean value, corresponding to the periods 1960–1970
and 1982–2000. Similarly, MAEPI estimated for the future scenario periods (2005–2110) for both pathways RCP4.5 and RCP8.5 showed marked inter-annual fluctuations overlapping on the
decreasing trends, with a fluctuation range of about ± 15% around the 11-yrs moving average, which appear reaching and exceeding the mean value of the “historical experiment” period (538.8
mm) only in few years until 2070, for the RPC 4.5 pathway scenario, and until 2040, for the PRC 8.5 one. DISCUSSION In this work, an application of RCM climate models is proposed as a
practical tool to assess, analyse and predict the effects of climate change until the end of the current century on the hydrological variables that control groundwater recharge processes in
the principal aquifer systems of southern Italy, which are chiefly represented by karst aquifers. Among the most relevant outcomes of this research, the ensemble of RCMs (E15) for
precipitation (E15P) and air temperature (E15T) overperforms the representation of observed precipitation (OBSP) and air temperature (OBST) data, with respect to the individual models. Data
were recorded over the whole region in the Calibration period (1950–1996) by the SIMN national meteorological network, even discontinuously in space and time. According to the regional scale
of analysis, needed for the hydrogeological purposes, the research was focused on the comparison of E15P and E15T to OBSP and OBST in order to assess statistical differences, namely the
bias between the modelled and observed data. In such a view, this work can be conceived novel in the field of application of RCMs because comparing modelled and observed meteorological data
on a regional scale by accounting for the spatial and temporal discontinuity of observed time series, which is a common issue of the regional meteorological networks. The _bias-correction_
method proposed in this study is based on inferential statistical analysis of precipitation and air temperature values of both E15 and OBS data, which are discontinuous in space and time.
The method proposed allows the management of OBS data aggregated at the annual scale for the estimation of the groundwater recharge, thus not requiring precipitation data aggregated at the
daily or monthly time scales with continuous time series as needed for other bias-correction methods such as linear scaling (LS)58,59, local intensity scaling (LOCI)58,60, and the quantile
mapping (QM)59. Moreover, the approach adopted, even being similar to the ISI-MIP method61, due to the definition of correction coefficients based on inferential statistical analyses of
modelled and observed time series at daily and monthly time scales, is innovative because considering the annual time scale and the regional scale. The RCP 4.5 (intermediate) and RCP 8.5
(severe) scenarios used for the E15 are widely applied in studies dealing with the impact of climate change on groundwater regime in the Mediterranean area (Table 1). Under the conditions
projected by the RCP8.5 scenario, the impacts of climate change on the Mediterranean region would be particularly severe with an increase in the average air temperature of several degrees by
21004,5. Even though the RCP 8.5 scenario is the least likely49, its application is justifiable because representing the most severe, thus being consistent with the precautionary
principle62. Precipitation and air temperature rates resulting from the E15, related to scenarios of both RCP8.5 and RCP4.5 pathways, show trends consistent with those described in various
climatological studies carried out in the central and southern Italy45,57,63,64,65. In the same way, MAEPI derived by E15 variables, show a complex periodicity with decadal and overlapped
interannual fluctuations. Considering the calibration period (1950–1996), these complex fluctuations of both precipitation (P) and effective precipitation (Pe) were already recognized to be
related to the North Atlantic Oscillation56. Similarly, from the predictive scenarios, it can be seen how ETR and Pe are strongly controlled by the long-term decrease in precipitation and
increase in air temperature rates, especially considering the scenario regulated by the RCP8.5 pathways. In addition, the integrated analysis of MAEPI showed, by the filtering with the
11-yrs moving average, a complex periodicity of the time series with decreasing cycles until the end of the century for both RCP scenarios with a total decrease of the moving average value
down to − 20% for RCP4.5 and to − 50% for RCP8.5. Given the direct correlation between effective precipitation Pe (P – ETR) and groundwater recharge37, the future patterns of MAEPI indicate
the expected variability in groundwater recharge. This is strengthened if considering the very high permeability of karst aquifers that favours chiefly infiltration in comparison to runoff.
CONCLUSIONS The analysis of the impacts of climate change, under RCP 4.5 and RCP 8.5 scenarios, on air temperature (T), precipitation (P), actual evapotranspiration (ETR) and effective
precipitation Pe (P – ETR), controlling groundwater recharge of principal aquifer systems of southern Italy, was the main focus of this study. A methodology is presented in this study, aimed
to compare and correct P and T data of an ensemble mean of 15 RCMs (E15), at 0.11° (~ 12 km) grid spatial resolution, with observed values provided by a dense meteorological network which
functioned discontinuously in space and time over the period 1950–1996. E15 data and recordings of the regional meteorological network (OBS) show similar frequency distributions of P and T,
thus resulting statistically valid and comparable. E15 projections show a reduction in precipitation and an increase in air temperature under both RCPs, with a divergence point between the
two scenarios occurring by about 2040. As a result, Pe, which is considered as a proxy of groundwater recharge, is characterized by significant inter-annual fluctuations and shows decreasing
trends under both RCP scenarios, reaching a decrease of the 11-yrs moving average down to − 20%, for RCP4.5, and − 50% for the “business as usual” RCP8.5. In summary, the proposed
methodology can be considered valid for analysing the effects of climate variations at the regional scale on the selected hydrological variables (P, T, ETR and Pe) that control groundwater
recharge processes of principal aquifer systems of the southern Italy, from which the socio-economic development and environmental conservation of groundwater dependant ecosystems are
reliant on. This research has revealed the potential of RCMs in the definition of groundwater recharge scenarios under future changing climate conditions, highlighting the relevant
vulnerability of principal aquifer systems, among which the karst ones are the most important. DATA AVAILABILITY EURO-CORDEX simulations data are publicly available upon registration from
the nodes of the Earth System Grid Federation (ESGF; https://esgf.llnl.gov/) and the SIMN data of annual precipitation and mean annual temperature are freely available from the Italian
Institute for Environmental Protection and Research (ISPRA)
(https://www.isprambiente.gov.it/it/progetti/cartella-progetti-in-corso/acque-interne-e-marino-costiere-1/progetti-conclusi/progetto-annali). However, all raw data can be provided by the
corresponding authors upon request. REFERENCES * Stevanović, Z. Karst aquifers in the Arid World of Africa and the Middle East: Sustainability or humanity? In _Karst Water Environment:
Advances in Research, Management and Policy_ 1–43 (Springer International Publishing, 2018). Google Scholar * Compagnucci, R. _et al._ Nigel Arnell (UK) and Chunzhen Liu (China). _Climate
Change 2001: Impacts, Adaptation, and Vulnerability: Contribution of Working Group II to the Third Assessment Report of the Intergovernmental Panel on Climate Change_ 2, 191 (2001). Google
Scholar * Huntington, T. G. Evidence for intensification of the global water cycle: Review and synthesis. _J. Hydrol._ 319, 83–95 (2006). ADS Google Scholar * IPCC. Summary for
policymakers_. In Global Warming of 1.5°C. An IPCC Special Report on the Impacts of Global Warming of 1.5 °C above Pre-Industrial Levels and Related Global Greenhouse Gas Emission Pathways,
in the Context of Strengthening the Global Response to the Threat of Climate Change, Sustainable Development, and Efforts to Eradicate Poverty _(Eds Masson-Delmotte, V., P. Zhai, H.-O.
Pörtner, D. Roberts, J. Skea, P.R. Shukla, A. Pirani, W. Moufouma-Okia, C. Péan, R. Pidcock, S. Connors, J.B.R. Matthews, Y. Chen, X. Zhou, M.I. Gomis, E. Lonnoy, T. Maycock, M. Tignor, and
T. Waterfield) (Cambridge University Press, 2018). * IPCC. _Climate Change 2014: Synthesis Report. Contribution of Working Groups I, II and III to the Fifth Assessment Report of the
Intergovernmental Panel on Climate Change [Core Writing Team, R.K. Pachauri and L.A. Meyer (Eds.)]. IPCC, Geneva, Switzerland_, Pp 151 (2014). * Giorgi, F. Climate change hot-spots.
_Geophys. Res. Lett._ 33, 025734 (2006). Google Scholar * Giorgi, F., Jones, C. & Asrar, G. Addressing climate information needs at the regional level: the CORDEX framework. _Organ.
(WMO) Bull._ 58, 175–183 (2009). Google Scholar * Kjellström, E. _et al._ Emerging regional climate change signals for Europe under varying large-scale circulation conditions. _Clim. Res._
56, 103–119 (2013). Google Scholar * D’Oria, M., Tanda, M. G. & Todaro, V. Assessment of local climate change: Historical trends and RCM multi-model projections over the Salento Area
(Italy). _Water (Switzerland)_ 10, 978 (2018). Google Scholar * Taylor, R. G. _et al._ Ground water and climate change. _Nat. Clim. Change_ 3, 322–329 (2013). ADS Google Scholar * Green,
T. R. _et al._ Beneath the surface of global change: Impacts of climate change on groundwater. _J. Hydrol._ 405, 532–560 (2011). ADS Google Scholar * Van Vuuren, D. P. _et al._ The
representative concentration pathways: An overview. _Clim. Change_ 109, 5–31 (2011). ADS Google Scholar * Fernández, J. _et al._ Consistency of climate change projections from multiple
global and regional model intercomparison projects. _Clim. Dyn._ 52, 1139–1156 (2019). Google Scholar * Holman, I. P., Allen, D. M., Cuthbert, M. O. & Goderniaux, P. Towards best
practice for assessing the impacts of climate change on groundwater. _Hydrogeol. J._ 20, 1–4 (2012). ADS Google Scholar * Kurylyk, B. L. & MacQuarrie, K. T. B. The uncertainty
associated with estimating future groundwater recharge: A summary of recent research and an example from a small unconfined aquifer in a northern humid-continental climate. _J. Hydrol._ 492,
244–253 (2013). ADS Google Scholar * Stigter, T. Y. _et al._ Comparative assessment of climate change and its impacts on three coastal aquifers in the Mediterranean. _Reg. Environ.
Change_ 14, 41–56 (2012). Google Scholar * Stigter, T. Y. _et al._ Comparative assessment of climate change and its impacts on three coastal aquifers in the Mediterranean. _Reg. Environ.
Change_ 14, 41–56 (2014). Google Scholar * Pulido-Velazquez, D., García-Aróstegui, J. L., Molina, J. & Pulido-Velazquez, M. Assessment of future groundwater recharge in semi-arid
regions under climate change scenarios (Serral-Salinas aquifer, SE Spain). Could increased rainfall variability increase the recharge rate?. _Hydrol. Process._ 29, 828–844 (2015). ADS
Google Scholar * Pulido-Velazquez, D., Collados-Lara, A. J. & Alcalá, F. J. Assessing impacts of future potential climate change scenarios on aquifer recharge in continental Spain. _J.
Hydrol._ 567, 803–819 (2018). ADS Google Scholar * D’Oria, M., Ferraresi, M. & Tanda, M. G. Quantifying the impacts of climate change on water resources in northern Tuscany, Italy,
using high-resolution regional projections. _Hydrol. Process._ 33, 978–993 (2019). ADS Google Scholar * Pardo-Igúzquiza, E., Collados-Lara, A. J. & Pulido-Velazquez, D. Potential
future impact of climate change on recharge in the Sierra de las Nieves (southern Spain) high-relief karst aquifer using regional climate models and statistical corrections. _Environ. Earth
Sci._ 78, 1–12 (2019). Google Scholar * Nerantzaki, S. D. & Nikolaidis, N. P. The response of three Mediterranean karst springs to drought and the impact of climate change. _J. Hydrol._
591, 125296 (2020). Google Scholar * Voulanas, D. _et al._ Assessment of potential hydrological climate change impacts in the Kastoria basin (Western Macedonia, Greece) using EURO-CORDEX
regional climate models. Zollo A. _Int. J. Climatol._ 36, 987–1004 (2021). Google Scholar * IPCC. Towards new scenarios for analysis of emissions, climate change, impacts, and response
strategies. IPCC EXPERT MEETING REPORT. _Clim. Change Impacts Response Strat_., 132 (2008). * Jacob, D. _et al._ EURO-CORDEX: New high-resolution climate change projections for European
impact research. _Reg. Environ. Change_ 14, 563–578 (2014). Google Scholar * Moss, R. H. _et al._ The next generation of scenarios for climate change research and assessment. _Nature_ 463,
747–756 (2010). ADS CAS Google Scholar * Sulis, M., Paniconi, C., Marrocu, M., Huard, D. & Chaumont, D. Hydrologic response to multimodel climate output using a physically based model
of groundwater/surface water interactions. _Water Resour. Res._ https://doi.org/10.1029/2012WR012304 (2012). Article Google Scholar * Teutschbein, C. & Seibert, J. Bias correction of
regional climate model simulations for hydrological climate-change impact studies: Review and evaluation of different methods. _J. Hydrol._ 456–457, 12–29 (2012). Google Scholar *
Gudmundsson, L., Bremnes, J. B., Haugen, J. E. & Engen-Skaugen, T. Hydrology and earth system sciences technical note: Downscaling RCM precipitation to the station scale using
statistical transformations-a comparison of methods. _Hydrol. Earth Syst. Sci._ 16, 3383–3390 (2012). ADS Google Scholar * De Vita, P. _et al._ Hydrogeology of continental southern Italy.
_J. Maps_ 14, 230–241 (2018). Google Scholar * Bonardi, G. _et al._ Carta delle principali unità cinematiche dell’appennino meridionale. Nota illustrative. _Boll. della Soc. Geol. Ital._
128, 47–60 (2009). Google Scholar * Mostardini, F. & Merlini, S. Appennino centro meridionale, sezioni geologiche e proposta di modello strutturale. [Central-southern Apennine,
geological crosssections and proposal of a structural model. _Mem. Soc. Geol. Ital._ 35, 177–202 (1986). Google Scholar * Ruggieri, G. _et al._ Testing evapotranspiration estimates based on
MODIS satellite data in the assessment of the groundwater recharge of karst aquifers in southern Italy. _Water_ 13, 118 (2021). Google Scholar * Celico, P. B. Idrogeologia dei massicci
carbonatici, delle piane quaternarie e delle aree vulcaniche dell Italia centro-meridionale (Marche e Lazio meridionali, Abruzzo, Molise e Campania). _Idrogeologia dei massicci carbonatici,
delle piane quaternarie e delle aree vulcaniche dell Italia centro-meridionale (Marche e Lazio meridionali, Abruzzo, Molise e Campania)_ 4/2, 1–225 (1983). Google Scholar * Petrella, E.,
Aquino, D., Fiorillo, F. & Celico, F. The effect of low-permeability fault zones on groundwater flow in a compartmentalized system. Experimental evidence from a carbonate aquifer
(Southern Italy). _Hydrol. Process._ 29, 1577–1587 (2015). ADS Google Scholar * Allocca, V., De Vita, P., Manna, F. & Nimmo, J. R. Groundwater recharge assessment at local and episodic
scale in a soil mantled perched karst aquifer in southern Italy. _J. Hydrol._ 529, 843–853 (2015). ADS Google Scholar * Allocca, V., Manna, F. & De Vita, P. Estimating annual
groundwater recharge coefficient for karst aquifers of the southern Apennines (Italy). _Hydrol. Earth Syst. Sci._ 18, 803–817 (2014). ADS Google Scholar * Fusco, F., Allocca, V. & De
Vita, P. Hydro-geomorphological modelling of ash-fall pyroclastic soils for debris flow initiation and groundwater recharge in Campania (southern Italy). _Catena_ 158, 235–249 (2017). Google
Scholar * Cusano, D. _et al._ A comparison of methods for assessing groundwater vulnerability in karst aquifers: The case study of Terminio Mt. aquifer (Southern Italy). _Sustain. Environ.
Res._ 33, 42 (2023). CAS Google Scholar * Tufano, R. _et al._ Groundwater vulnerability of principal aquifers of the Campania region (southern Italy). _J. Maps_ 16, 565–576 (2020). Google
Scholar * Allocca, V. _et al._ Hydrogeological and hydrogeochemical study of a volcanic-sedimentary coastal aquifer in the archaeological site of Cumae (Phlegraean Fields, southern Italy).
_J. Geochem. Explor._ 185, 105–115 (2018). CAS Google Scholar * Cusano, D. _et al._ The survey of Italian springs by the National Hydrographic Service, a forgotten database. Structuring
and analysis of a dataset of Campania springs (southern Italy). _AS-ITJGW_ 11, 31–41 (2022). Google Scholar * Olarinoye, T. _et al._ Global karst springs hydrograph dataset for research and
management of the world’s fastest-flowing groundwater. _Sci. Data_ 7, 59 (2020). PubMed Central Google Scholar * Bucchignani, E., Mercogliano, P., Panitz, H.-J. & Montesarchio, M.
Climate change projections for the Middle East-North Africa domain with COSMO-CLM at different spatial resolutions. _Adv. Clim. Change Res._ 9, 66–80 (2018). Google Scholar * Bucchignani,
E., Montesarchio, M., Zollo, A. L. & Mercogliano, P. High-resolution climate simulations with COSMO-CLM over Italy: Performance evaluation and climate projections for the 21st century.
_Int. J. Climatol._ 36, 735–756 (2016). Google Scholar * Bucchignani, E., Montesarchio, M., Cattaneo, L., Manzi, M. P. & Mercogliano, P. Regional climate modeling over China with
COSMO-CLM: Performance assessment and climate projections. _J. Geophys. Res. Atmos._ 119, 12–151 (2014). Google Scholar * Spinoni, J. _et al._ Future global meteorological drought hot
spots: A study based on CORDEX data. _J. Clim._ 33, 3635–3661 (2020). ADS Google Scholar * Zittis, G. _et al._ Business-as-usual will lead to super and ultra-extreme heatwaves in the
Middle East and North Africa. _NPJ Clim. Atmos. Sci._ 4, 20 (2021). Google Scholar * Hausfather, Z. & Peters, G. P. Emissions–the ‘business as usual’story is misleading. _Nature_ 577,
618–620 (2020). ADS CAS Google Scholar * Schulzweida, U. CDO user guide. Zenodo https://doi.org/10.5281/zenodo.7112925 (2022). * Trzaska, S. & Schnarr, E. A review of downscaling
methods for climate change projections. _United States Agency for International Development by Tetra Tech ARD_, 1–42 (2014). * Shaw, E., Beven, K. J., Chappell, N. A. & Lamb, R.
_Hydrology in Practice_ (CRC Press, 2010). Google Scholar * Turc, L. L. Bilan d’eau des sols: Relations entre les précipitations, l’évaporation et l’écoulement. _Journées de l’hydraulique_
3, 36–44 (1955). Google Scholar * Coutagne, A. Quelques considérations sur le pouvoir évaporant de l’atmosphère, le déficit d’écoulement effectif et le déficit d’écoulement maximum. _La
Houille Blanche_ 40, 360–374 (1954). ADS Google Scholar * Thornthwaite, C. W. The water balance. _Climatology_ 8(1), 1–104 (1955). Google Scholar * De Vita, P., Allocca, V., Manna, F.
& Fabbrocino, S. Coupled decadal variability of the North Atlantic Oscillation, regional rainfall and karst spring discharges in the Campania region (southern Italy). _Hydrol. Earth
Syst. Sci._ 16, 1389–1399 (2012). ADS Google Scholar * Zollo, A. L., Rillo, V., Bucchignani, E., Montesarchio, M. & Mercogliano, P. Extreme temperature and precipitation events over
Italy: Assessment of high-resolution simulations with COSMO-CLM and future scenarios. _Int. J. Climatol._ 36, 987–1004 (2016). Google Scholar * Schmidli, J., Frei, C. & Vidale, P. L.
Downscaling from GCM precipitation: A benchmark for dynamical and statistical downscaling methods. _Int. J. Climatol._ 26, 679–689 (2006). Google Scholar * Wetterhall, F., Pappenberger, F.,
He, Y., Freer, J. & Cloke, H. Conditioning model output statistics of regional climate model precipitation on circulation patterns. _Nonlinear Process. Geophys._ 19, 623–633 (2012). ADS
Google Scholar * Themeßl, M. & Gobiet, A. Empirical-statistical downscaling and model error correction of daily temperature and precipitation from regional climate simulations and the
effects on climate change signals. In _Proc. of the EGU General Assembly, Vienna, Austria_, 2–7 (2010). * Hempel, S., Frieler, K., Warszawski, L., Schewe, J. & Piontek, F. A
trend-preserving bias correction—The ISI-MIP approach. _Earth Syst. Dyn._ 4, 219–236 (2013). ADS Google Scholar * Ricci, P. F. & Sheng, H. _Benefits and Limitations of the
Precautionary Principle_ (Elsevier, 2013). Google Scholar * D’Oria, M., Balacco, G., Todaro, V., Alfio, M. R. & Tanda, M. G. Assessing the impact of climate change on a coastal karst
aquifer in a semi-arid area. _Groundw. Sustain. Dev._ 25, 101131 (2024). Google Scholar * Alfio, M. R., Pisinaras, V., Panagopoulos, A. & Balacco, G. A comprehensive assessment of
RCP4.5 projections and bias-correction techniques in a complex coastal karstic aquifer in the Mediterranean. _Front. Earth Sci._ 11, 1231296 (2023). ADS Google Scholar * Braca, G.,
Bussettini, M., Ducci, D., Lastoria, B. & Mariani, S. Evaluation of national and regional groundwater resources under climate change scenarios using a GIS-based water budget procedure.
_Rend. Lincei. Sci. Fis. Nat._ 30, 109–123 (2019). Google Scholar Download references ACKNOWLEDGEMENTS Authors acknowledge the funding of the research by the PhD Program of Dipartimento di
Scienze della Terra, dell’Ambiente e delle Risorse (DiSTAR), Università di Napoli Federico II (36th cycle). The research was funded by European Union—NextGenerationEU—Mission 4 “Education
and Research”—Component 2 “From Research to Business” – Investment 3.1 “Fund for the realization of an integrated system of research and innovation infrastructures”—Project IR0000037 — CUP
I53C22000800006 — GeoSciences IR. AUTHOR INFORMATION AUTHORS AND AFFILIATIONS * Department of Earth, Environmental and Resource Sciences (DiSTAR), University of Naples Federico II, 80126,
Naples, Italy Daniele Lepore, Vincenzo Allocca, Silvio Coda, Delia Cusano & Pantaleone De Vita * Meteorology Laboratory, Centro Italiano Ricerche Aerospaziali (CIRA), 81043, Capua, Italy
Edoardo Bucchignani & Myriam Montesarchio Authors * Daniele Lepore View author publications You can also search for this author inPubMed Google Scholar * Edoardo Bucchignani View author
publications You can also search for this author inPubMed Google Scholar * Myriam Montesarchio View author publications You can also search for this author inPubMed Google Scholar *
Vincenzo Allocca View author publications You can also search for this author inPubMed Google Scholar * Silvio Coda View author publications You can also search for this author inPubMed
Google Scholar * Delia Cusano View author publications You can also search for this author inPubMed Google Scholar * Pantaleone De Vita View author publications You can also search for this
author inPubMed Google Scholar CONTRIBUTIONS D.L. conceptualization, data curation, formal analysis, investigation, methodology, software, validation, visualization, writing – original draft
and writing – review & editing. E.B. conceptualization, data curation, formal analysis, investigation, methodology, validation and writing – review & editing. M.M.
conceptualization, data curation, formal analysis, investigation, methodology, software, validation and writing – review & editing. V.A. conceptualization, data curation, formal
analysis, investigation, methodology, validation, writing – original draft and writing – review & editing. D.C. and S.C. conceptualization, data curation, formal analysis, investigation,
methodology, software, validation and writing – review & editing. P.D.V. conceptualization, data curation, formal analysis, investigation, methodology, software, validation, writing –
original draft, writing – review & editing, project administration. CORRESPONDING AUTHOR Correspondence to Daniele Lepore. ETHICS DECLARATIONS COMPETING INTERESTS The authors declare no
competing interests. ADDITIONAL INFORMATION PUBLISHER'S NOTE Springer Nature remains neutral with regard to jurisdictional claims in published maps and institutional affiliations.
RIGHTS AND PERMISSIONS OPEN ACCESS This article is licensed under a Creative Commons Attribution-NonCommercial-NoDerivatives 4.0 International License, which permits any non-commercial use,
sharing, distribution and reproduction in any medium or format, as long as you give appropriate credit to the original author(s) and the source, provide a link to the Creative Commons
licence, and indicate if you modified the licensed material. You do not have permission under this licence to share adapted material derived from this article or parts of it. The images or
other third party material in this article are included in the article’s Creative Commons licence, unless indicated otherwise in a credit line to the material. If material is not included in
the article’s Creative Commons licence and your intended use is not permitted by statutory regulation or exceeds the permitted use, you will need to obtain permission directly from the
copyright holder. To view a copy of this licence, visit http://creativecommons.org/licenses/by-nc-nd/4.0/. Reprints and permissions ABOUT THIS ARTICLE CITE THIS ARTICLE Lepore, D.,
Bucchignani, E., Montesarchio, M. _et al._ Impact scenarios on groundwater availability of southern Italy by joint application of regional climate models (RCMs) and meteorological time
series. _Sci Rep_ 14, 20337 (2024). https://doi.org/10.1038/s41598-024-70257-1 Download citation * Received: 27 April 2024 * Accepted: 14 August 2024 * Published: 05 November 2024 * DOI:
https://doi.org/10.1038/s41598-024-70257-1 SHARE THIS ARTICLE Anyone you share the following link with will be able to read this content: Get shareable link Sorry, a shareable link is not
currently available for this article. Copy to clipboard Provided by the Springer Nature SharedIt content-sharing initiative KEYWORDS * Groundwater recharge * Karst aquifers * RCMs * Southern
Italy