Differential epithelial and stromal LGR5 expression in ovarian carcinogenesis
- Select a language for the TTS:
- UK English Female
- UK English Male
- US English Female
- US English Male
- Australian Female
- Australian Male
- Language selected: (auto detect) - EN
Play all audios:
Lgr5 has been identified as a marker of the stem/progenitor cells in the murine ovary and oviduct by lineage tracing. However, little is known regarding LGR5 expression or its functional
significance in human ovary tissues. Here, using RNA in situ hybridization and/or immunohistochemistry, we thoroughly investigated LGR5 expression in normal human ovaries, fallopian tubes
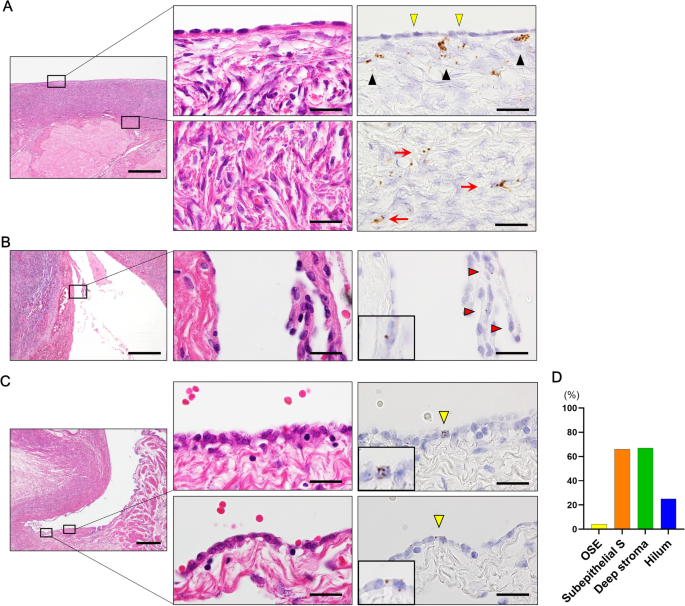
and various ovarian tumors. We discovered that LGR5 expression is negligible in the human ovary surface epithelium, whereas ovarian stromal cells normally express low levels of LGR5.
Remarkably, fallopian tube epithelium, inclusion cysts and serous cystadenomas with a Müllerian phenotype expressed high levels of LGR5, and LGR5 expression was restricted to PAX8+/FOXJ1−
secretory cells of the tubal epithelium. Strong stromal LGR5 expression without epithelial LGR5 expression was consistently observed in the path from serous cystadenoma to serous borderline
tumor to low grade serous carcinoma (LGSC). Unlike LGSC, high grade serous carcinoma (HGSC), clear cell carcinoma, endometrioid carcinomas displayed various epithelial-stromal LGR5
expression. Notably, high levels of LGR5 expression were observed in serous tubal intraepithelial carcinoma, which slightly declined in invasive HGSC. LGR5 expression was significantly
associated with improved progression-free survival in HGSC patients. Moreover, in vitro assays demonstrated that LGR5 expression suppressed tumor proliferation and migratory capabilities.
Taken together, these findings indicate a tumor-suppressive role for LGR5 in the progression of HGSC.
Ovarian epithelial tumors are heterogeneous neoplasms primarily classified according to cell type and are subdivided into benign, borderline, and malignant based on the degree of cellular
proliferation and atypia, and the presence of stromal invasion1. Ovarian cancer has the lowest five year survival rate among gynecologic cancers at 46%2. Over 70% of patients are diagnosed
with advanced-stage disease3 and their five-year survival rates are only 29%, by contrast with 92% for early-stage disease4. Annually worldwide, 314 000 women are diagnosed and 207 000 die
of ovary cancers5. Carcinomas are the most common ovarian cancers accounting for 90% of cases, and five main types have been identified: high grade serous carcinoma (HGSC), endometroid
carcinoma (EC), clear-cell carcinoma (CCC), mucinous carcinoma (MC), and low-grade serous carcinoma (LGSC)6. Depending on their clinicopathological features and molecular profile, these
subtypes can be classified either type 1 or type 2 tumors. Type 1 carcinomas include clear cell, endometrioid, mucinous, and LGSC, while type 2 carcinomas mainly comprise HGSCs7. Type 2
carcinomas are more frequently detected in advanced stage, and display a universal TP53 mutations7.
Lgr5 has been identified as an adult stem cell marker in multiple organs such as small and large intestines, stomach, hair follicle, kidney, breast, and liver8,9,10,11,12,13. Lgr5+ stem
cells have been demonstrated to be the cells of origin of multiple tumor types in the stomach, intestine, and liver14,15,16. Furthermore, Lgr5+ cancer cells have been shown to serve as
so-called cancer stem cells in growing cancer tissues17,18. Lineage tracing studies in the mice have revealed that multiple local Lgr5+ cells contribute to homeostatic maintenance and rapid
restoration of the surface epithelia during ovulatory damage, suggesting Lgr5 as a marker of stem/progenitor populations of the ovary and tubal epithelia19. In addition, Lgr5-expressing
ovary surface epithelium (OSE) stem cells exhibit increased tumorigenicity in a TP53- and RB1-deficient background20. These findings clearly suggest that the resident Lgr5+ stem cells reside
in the OSE and may constitute the cell of origin of epithelial ovarian tumors19,20.
In contrast to the remarkable discoveries from mouse studies, there has been little investigation exploring LGR5 expression in human ovary/oviduct or ovarian epithelial tumors. To our
knowledge, only two studies have examined LGR5 expression in human ovarian tissues. Ng et al. demonstrated the presence of LGR5 transcripts in OSE and tubal epithelia using fluorescence in
situ hybridization (ISH) in the human ovary and distal fallopian tube19, but LGR5 expression in ovarian tumors was not explored. Amsterdam et al. examined LGR5 expression using IHC in normal
ovaries, borderline tumors, and serous carcinomas and reported that LGR5 expression was present in normal OSE, but not in ovarian tumors21. However, it is well known that RNA ISH is a much
more reliable method for detecting LGR5 expression in human FFPE specimens than IHC. Therefore, in this study we employed the RNA ISH and aimed to thoroughly investigate the expression
profile of LGR5 using RNA ISH in normal human ovary and fallopian tubes as well as various benign and malignant ovarian epithelial tumors.
This study included the following formalin-fixed and paraffin-embedded (FFPE) ovarian borderline tumor and carcinoma samples collected from the patients who underwent surgical resection at
Seoul National University Hospital (SNUH) (Seoul, Korea) from 2010 to 2021; LGSC (n = 12), HGSC (n = 64), endometrioid carcinoma (EC, n = 47), clear cell carcinoma (CCC, n = 48), mucinous
carcinoma (MC, n = 44), STIC lesions (n = 21), serous borderline tumor (SBT, n = 7), and mucinous borderline tumor (MBT, n = 7). STIC lesions were identified entirely from sampled fallopian
tubes according to the ‘sectioning and extensively examining the fimbriated end’ (SEE-FIM) protocol22. The classification of histological subtypes of carcinomas was independently determined
by two pathologists (C.L. and J.K.M.). For HGSC cases, clinicopathological data including age, FIGO stage, family history, serum CA-125 levels, BRCA1 and BRACA 2 mutation status, time of
death, tumor recurrence, and follow-up time were obtained by reviewing the clinical and pathologic reports23. For the validation study, a total of 1104 ovarian serous carcinoma patients were
included from the Kaplan–Meier-plotter datasets (http://kmplot.com/analysis). We also collected FFPE normal ovary/fallopian tube and benign lesion samples from the patients who underwent
surgical resection at Jeju National University Hospital (JNUH) (Jeju, Korea) from 2018 to 2021. This study was approved by the Institutional Review Board (IRB) of JNUH (2021–07-007) and SNUH
(H-2202–031-1297). The IRB confirmed that informed consent for FFPE samples was waived due to the retrospective nature of the study. All procedures were performed in accordance with the
ethical standards of the Helsinki Declaration of 1964 and subsequent versions.
Three TMAs containing 64 HGSC cores and 47 MC cores were previously assembled23. In total, 9 TMAs were newly constructed including normal ovaries and fallopian tubes as well as a variety of
benign and malignant lesions. In brief, a single representative area comprising more than 70% of tumor cell population was identified through microscopic examination and marked on a
hematoxylin and eosin (H&E) slide. Core tissue cylinders with a 4 mm in diameter were collected from an individual FFPE specimen of paraffin block and arranged in a new recipient paraffin
block using a trephine apparatus (SuperBioChips Laboratories, Seoul, Korea).
Immunohistochemistry (IHC) for P53, PAX8, FOXJ1, estrogen receptor and β-catenin was performed on 4-μm TMA sections using a BOND-MAX automated immunostainer and a Bond Polymer Refine
Detection kit (Leica Microsystems, Wetzlar, Germany) according to the manufacturer’s guidelines. The primary antibodies were anti-P53 (DAKO, 1:1000), anti-PAX8 (Proteintech, 1:300),
anti-FOXJ1 (Invitrogen, 1:100), anti-estrogen receptor (DAKO, 1:100), and anti-β-catenin (BD Transduction, 1:800). Estrogen receptor and β-catenin were considered positive when more than 10%
of tumor cell nuclei were strongly stained.
RNA in situ hybridization (ISH) performed using RNAscope FFPE assay kit (Advanced Cell Diagnostics, Hayward, CA) as previously described24. Briefly, 4-μm FFPE tissue sections are pretreated
with heat and protease digestion followed by hybridization with the probe. Then, an HRP-based signal amplification system was hybridized to a probe before color development with
3,3′-diaminobenzeidine tetrahydrochloride (DAB). Cases with UBC easily visible under a 10 × objective lens were considered to be adequate according to the manufacturer’s recommendation.
Positive staining was indicated by brown punctate dots in the nucleus and/or cytoplasm. LGR5 transcripts were quantified according to the manufacturer’s scoring guidelines: score 0, no
staining; score 1: one to three dots per cell; score 2: four to 10 dots per cell; score 3: more than 10 dots per cell; score 4: more than 15 dots per cell. The housekeeping gene ubiquitin C
(UBC) and the bacterial gene DapB served as positive and negative controls, respectively. The histo-scores (H-scores) were calculated as follows: RNAscope score × % of positive cells,
ranging from 0 to 400. For statistical analyses, H-score of 40 was chosen based on the median (H-score: 20) and mean (H-score: 56) values of LGR5 H-scores; the tumor was considered high
(H-score > 40) when more than 20% of tumor cells express LGR5 with a score 2 or higher.
We performed a combined RNA ISH and multiplex IHC by sequentially performing RNA ISH and multiple IHC on identical TMA slides as previously described25. Briefly, RNA ISH for LGR5 was first
performed, followed by scanning and image acquisition of the entire TMA slide using an Aperio AT2 scanner (Leica Biosystems, Newcastle upon Tyne, UK). Then, the slide was subjected to IHC
for FOXJ1 staining. After scanning the newly stained slide, it was treated with stripping buffer (20% sodium dodecyl sulfate, 0.5 M Tris–HCl pH 6.8, β-mercaptoethanol, and distilled water)
and microwaved to perform additional stripping. After antigen retrieval, IHC for PAX8 staining was performed on the same slide followed by scanning. For analysis, each 4-mm TMA core of the
virtual TMA slides was extracted using an Aperio ImageScope (Leica Biosystems). CellProfiler (ver. 3.1.8. Broad Institute, Cambridge, MA) was used to further process the core images. All
core images from each staining procedure were converted into grayscale images and each positive expression within the cores was further converted to a specific color; blue for LGR5, red for
PAX8 IHC, and green for FOXJ1 IHC. For each core, three pseudocolor images representing the three stains were aligned and merged into a single image. DAB staining of RNA ISH for LGR5 is
irremovable and therefore remains during subsequent IHC and scanning procedures. As a result, LGR5 expression remains in all three scanned images and appears white when the three-color
images are merged.
Four human HGSC cell lines (CaoV-3, NIH OVCAR-3, SNU-8, and SNU-119) were purchased from the Korean Cell Line Bank (Seoul, Korea). Cells were cultured in RPMI 1640 medium (Welgene, Daegu,
Korea) containing 10% fetal bovine serum (FBS) (Gibco, Carlsbad, CA) and 1% penicillin/streptomycin (Gibco) and maintained at 37 °C in a humidified incubator with 5% CO2. Full-length cDNA
encoding LGR5 (pEX-LGR5) and control vector were purchased from GeneCopoeia (Rockville, MD). Cancer cells were seeded at 1 × 10⁵ cells/well in 6-well plates after transfection with control
vector or pEX-LGR5 (2.5 μg) using the Neon transfection system (Thermo Fisher Scientific). One or two days after transfection, the cells were subjected to real-time PCR, immunoblotting or
functional assays.
Cellular proteins were extracted in lysis buffer (iNtRON Biotechnology, Seongnam, Korea) and quantified using BCA protein assay kits (Pierce, Rockford, IL, USA). Cell lysates were run on a
10% SDS–polyacrylamide gel and were transferred to a PVDF membrane (Millipore Corporation, Bedford, MA, USA). The membrane was blocked in 5% nonfat dry milk in PBS-Tween-20 (0.1%, v/v) for 1
h and incubated with primary antibodies overnight at 4 °C. After washing with TBS containing 0.1% Tween-20, the membrane was incubated for 1 h with secondary antibodies. Alliance-Mini. An
HD9 chemiluminescence documentation system (UVItec Cambridge, UK) was used to visualize target proteins. Anti-LGR5 (ab238518) and anti–GAPDH (catalog number: #TA505454) antibodies were
purchased from Abcam and Origene, respectively. Anti-ERK (catalog number: #4695), anti-AKT (catalog number: #4691), anti-phospho-ERK (catalog number: #4370), anti-phospho-AKT (catalog
number: #4060), anti-cleaved PARP (catalog number: #5625), anti-cleaved caspase-3 (catalog number: #9661) and anti-BIM (catalog number: #2933) antibodies were purchased from Cell Signaling
Technology (Danvers, MA, USA).
Cells were harvested 1 day after transfection, seeded at 5 × 10³ cells/well in a 96-well plate and incubated at 37 °C. At the indicated time points, cell growth was evaluated by adding 10 μl
of Cell Counting Kit-8 reagent (Dojindo, Kumamoto, Japan) into each well and incubating for an hour. Absorbance was measured at 450 nm using a spectrophotometer (Thermo Labsystems,
Rockford, IL, USA).
Caspase-3 enzymatic activity was measured using a Caspase-Glo 3 Assay Kit (Promega, Madison, WI, USA, catalog number: G8091). After transfection with control or LGR5-containing vector,
OVCAR-3 or SNU-8 cells (1 × 10⁴ cells/mL) were seeded and cultured in 96-well plates (100 μL/well) for 24 h in triplicate. Caspase-Glo Reagent (100 μL/well) was added to each well and the
cells were incubated in the dark at room temperature for 3 h on a shaker. The luminescence in each well was measured using the GloMax Navigator System (Promega).
Cells were starved in serum-free RPMI medium for three hours. After starvation, the cells were harvested with trypsin treatment and resuspended. Twenty four–well culture plates were divided
into upper and lower wells by a transwell insert (pore size, 8 mm) (BD Bioscience, San Diego, CA). The upper surface of the transwell was loaded with 2 × 10⁵ cells in 300 μL serum-free RPMI
medium and the lower wells contained 500 μL RPMI with 10% FBS. After 24 h of incubation, nonmigrated cells were removed from the top of each insert using a cotton swab. Migrated cells on the
bottom surface were fixed in methanol for 10 min and counted after staining with crystal violet for one hour. All experiments were independently performed at least two to three times.
Statistical analyses were performed using SPPSS software version 18.0 (SPSS, Chicago, IL) and Prism version 9.0.0 (GraphPad Software, San Diego, CA;
https://www.graphpad.com/scientific-software/prism). Between-group comparisons of LGR5 H-scores in epithelial or stroma cells were performed using Student’s t test or Turkey’s multiple
comparisons test. Correlations between LGR5 expression and clinicopathological parameters were assessed using Pearson’s chi-square test. Survival curves were estimated using the Kaplan–Meier
method, and the log-rank test was used to compare groups. A P value