Clinical findings and predictive factors for positive anti-interferon-γ autoantibodies in patients suffering from a non-tuberculosis mycobacteria or talaromyces marneffei infection: a multicenter prospective cohort study
- Select a language for the TTS:
- UK English Female
- UK English Male
- US English Female
- US English Male
- Australian Female
- Australian Male
- Language selected: (auto detect) - EN
Play all audios:
ABSTRACT We investigated the clinical features and screened for predictive factors of anti-interferon-γ autoantibody (AIGA) positivity. We enrolled 63 AIGA-positive (group 1) and 29
AIGA-negative (group 2) HIV-negative patients. White blood cell (WBC) and neutrophil counts, erythrocyte sedimentation rate (ESR), and C-reactive protein (CRP), globulin, immunoglobulin (Ig)
G, and IgM levels were higher, whereas CD4+T cell count and hemoglobin level were lower in group 1 than in group 2. Co-infections, multiple infections, and disseminated infections were
significantly higher in group 1 than in group 2. Prognosis was worse in group 1 than in group 2, especially for relapse and persistent infections. The number of infecting pathogens and sites
involved; WBC and neutrophil counts; globulin, IgG, IgM, and CRP levels; and ESR were significantly positively correlated with AIGA titers; however, CD4+T cell count was significantly
negatively correlated with AIGA titers. Therefore, IgG, globulin, and CRP levels; CD4+T cell and WBC counts; the number of infecting pathogens and sites involved; and ESR were considered
potential predictors for AIGA positivity. For HIV-negative hosts with double or multiple opportunistic, disseminated infections and high serum IgG and globulin levels, low CD4+T cell count,
and an increase in inflammatory marker levels, positive AIGA-associated immunodeficiency should be considered. SIMILAR CONTENT BEING VIEWED BY OTHERS _TALAROMYCES MARNEFFEI_ AND
NONTUBERCULOUS MYCOBACTERIA CO-INFECTION IN HIV-NEGATIVE PATIENTS Article Open access 10 August 2021 LATENT AND ACTIVE TUBERCULOSIS INFECTION IN ALLOGENEIC HEMATOPOIETIC STEM CELL TRANSPLANT
RECIPIENTS: A PROSPECTIVE COHORT STUDY Article 08 May 2021 UNDERSTANDING AND INTERPRETING ANTINUCLEAR ANTIBODY TESTS IN SYSTEMIC RHEUMATIC DISEASES Article 05 November 2020 INTRODUCTION
Adult-onset immunodeficiency syndrome (AOID), caused by anti-interferon-γ autoantibody (AIGA), has been strongly associated with intracellular opportunistic infections in human
immunodeficiency virus (HIV)-negative adults1,2,3,4,5,6. In patients with positive AIGAs, several molecular mechanisms underlie interferon (IFN)-γ dysfunction, considered to primarily
inhibit signal transducer and activator of transcription 1 (STAT1) phosphorylation and interleukin-12 production, resulting in severe dysfunction of the Th1 response1,7. Patients with
positive AIGAs manifest clinically severe mycobacterial, _Talaromyces marneffei_ (TM), and salmonella infections, with double or multiple infections1,2,3,4,5,6. Since 2012, an increasing
number of patients have been diagnosed with AIGA, suggesting that AIGA production was previously underestimated. To date, more than 800 patients have been diagnosed with AIGAs7. The
diagnosis of AIGA disease requires the following two steps: 1) the detection of the AIGA titer by enzyme-linked immunosorbent assay (ELISA), particle-based assay, flow cytometry analysis, or
western blotting; and 2) an assessment of the neutralizing activity of these AIGAs: STAT-1 phosphorylation or human leukocyte antigen (HLA)-DR expression on IFN-γ-responsive cell assays are
the most widely used methods for assessing the neutralization potential of AIGA1,7,8. AOID has always been misdiagnosed due to the lack of clinical knowledge about it. However, the AIGA
titer is closely related to poor infection prognosis, especially in relapsed and refractory infections6. Thus, the timely detection of AIGA and diagnosis of AOID is essential to improve the
prognosis of infected patients. However, these methods of diagnosing positive AIGAs are time-consuming, require expensive instruments, and are used only for scientific research rather than a
routine clinical test. Therefore, in this study, we (1) compared AIGA-positive and AIGA-negative patients to elucidate the clinical characteristics of AIOD and (2) screened existing
clinical routine indicators to identify potential predictors of AIGAs for timely identification of AIGA positivity to evaluate host immunity and improve prognosis. RESULTS BASELINE
CHARACTERISTICS AND AIGA TITERS Based on the 99th percentile of the AIGA titers in 103 healthy volunteers, the cutoff for positivity was 6402.28 ng/ml. During the study, 63 AIGA-positive
cases (group 1) and 29 AIGA-negative cases (group 2) with TM and/or nontuberculosis mycobacteria (NTM) infection were enrolled. All 93 participants were HIV-negative. Sex distribution, age,
and body mass index (BMI) did not differ significantly between the groups (Table 1). The AIGA titers in group 1 (median 32,343.8 ng/ml with interquartile range 19,712.8–58,117.3 ng/ml) were
significantly higher than those in group 2 (median 3452.9 ng/ml with interquartile range 1985.7–3983.2 ng/ml) (_P_ < 0.001). COMPARISON OF CLINICAL FEATURES AND OUTCOMES BETWEEN THE
AIGA-POSITIVE AND AIGA-NEGATIVE GROUPS A comparison of the biomarkers and clinical parameters between the groups (Table 1) revealed that the AIGA titer, white blood cell (WBC) count,
neutrophil (N) count, erythrocyte sedimentation rate (ESR), and C-reactive protein (CRP) level in group 1 were higher than those in group 2 (_P_ < 0.00). The hemoglobin (HGB) level in
group 1 was lower than that in group 2 (_P_ < 0.01). Furthermore, the globulin, immunoglobulin (Ig) G, and IgM levels were higher in group 1 than in group 2 (_P_ < 0.05). In group 1,
there were 29 (45.3%) patients with co-infections or multiple infections, with the co-infection rate being significantly higher than that in group 2 (_P_ < 0.001). Besides, the number of
sites involved in group 1 was significantly higher than that in group 2 (_P_ < 0.001) (4 sites vs. 1 site, respectively) (Table 1). In group 1, the median CD4+ T lymphocyte count was 484
(with interquartile range 365–654) cells/µL, lower than the normal range. In addition, the CD4+ T lymphocyte count in group 1 was lower than that in group 2 (_P_ < 0.01). The CD4+ T
lymphocyte count of nine patients in group 1 was below the normal level (CD4+T cells < 410 cells/µL), and all nine patients had disseminated infections, persistent infections, and
co-infections. The prognosis and outcomes of patients in group 1 were worse than those of patients in group 2, especially in the case of persistent and relapse infections (_P_ < 0.001)
(Table 1). Nineteen (29.7%) patients had a persistent infection, 21 (32.8%) had a relapse infection, 9 (14.1%) died, and 15 (23.4%) were cured in group 1. In contrast, 5 (17.2%) patients had
a persistent infection, 6 (20.7%) had a relapse infection, 3 (10.3%) died, and 15 (51.7%) were cured in group 2. PEARSON CORRELATION AND UNIVARIATE LOGISTIC REGRESSION ANALYSIS FOR
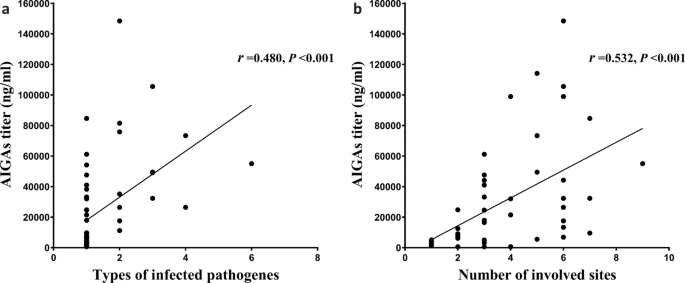
PREDICTIVE FACTORS OF AIGA POSITIVITY Pearson correlation analysis with a two-tailed test was used to correlate between AIGAs and clinical indices. The number of different types of infecting
pathogens (_P_ = 0.000, _r_ = 0.480) and number of sites involved (_P_ = 0.000, _r_ = 0.532) (Fig. 1); WBC (_P_ = 0.012, _r_ = 0.328) and neutrophil counts (_P_ = 0.027, _r_ = 0.291); ESR
(_P_ = 0.002, _r_ = 0.425); and CRP (_P_ = 0.000, _r_ = 0.528) (Fig. 2), globulin (_P_ = 0.000, _r_ = 0.589), IgG (_P_ = 0.000, _r_ = 0.755), and IgM (_P_ = 0.010, r = 0.388) (Fig. 3) levels
significantly positively correlated with AIGA titers. The CD4+T cell count significantly negatively correlated with AIGA titers (_P_ = 0.000, _r_ = − 0.596) (Fig. 3). The univariate
logistic regression analysis showed that the CD4+T cell; the number of types of infecting pathogens and sites involved; IgG, globulin, and CRP levels of patients are potential predictors for
AIGA positivity (Table 2). DISCUSSION Until now, the diagnostic criteria for Adult-onset immunodeficiency syndrome (AOID) have been unavailable, the clinical knowledge and attention about
AOID have been limited, and routine clinical tests for detecting AIGAs have been lacking. These resulted in the misdiagnosis of AOID . Therefore, finding potential clinical predictors of
AIGA positivity from existing clinical indicators is important for timely detection and diagnosis of AIGAs to evaluate host immunity and improve prognosis. In this study, we determined
significant predictors for AIGAs that could play a role in controlling the disease. This study provides the first evidence that high globulin and IgG levels, low CD4+T levels, double or
multiple infections, and disseminated infections could be potentially effective predictive factors of AIGA positivity in HIV-negative patients with TM and/or NTM infections. In this study,
the inflammatory markers for leukocyte count, CRP level, and ESR in AIGA-positive patients were significantly higher than those in AIGA-negative patients. A notable bone marrow response
prone to anemia and leukocytosis development in AIGA-positive patients was also observed. In addition, most patients who were AIGA-positive had systemic dissemination and double or multiple
infections frequently. These markers indicate more exuberant dissemination and multiple infections in patients with AIGA positivity. We found that globulin, IgG, and IgM levels in
AIGA-positive patients were higher than those in AIGA-negative cases. Furthermore, the AIGA titer was significantly positively correlated with IgG and serum globulin levels in patients. The
globulin level was high because the essence of AIGAs is immunoglobulins. After total immunoglobulin subclass evaluation and functional verification, including AIGA IgG, IgM, and IgA
subclasses, Browne et al. found that the isotypes and subtypes of AIGAs appear to be heterogeneous, and IgG1 and IgG4 were the most frequent subtypes in the population1,6,8. Moreover, AIGA
IgG can inhibit IFN-γ-dependent STAT1 phosphorylation, especially IgG48. However, AIGA IgA and IgM have binding activity; they do not neutralize inhibitory interferon-γ-dependent STAT1
phosphorylation1,8. These issues indicated that IgG-AIGA is the major subtype of AIGAs and neutralizing component to prevent interferon-γ-induced STAT1 phosphorylation. Therefore, the high
IgG level in peripheral blood can be used as an effective predictive factor in AIGA-positive patients, and the level of IgG can be used to evaluate the intensity of immunosuppression in
serum. The number of infecting pathogens is significantly positively correlated with AIGA titers, which may be associated with pathogens expressing the Noc2 protein. Lin CH et al. found that
pathogenic AIGAs may be produced from cross-reactivity between _Aspergillus spp._ and _M. intracellulare_ ribosomal assembly protein Noc2, especially Noc2 in Aspergillus spp. Furthermore,
these autoantibodies target a major epitope (P123–135 AAKTGKRKRSQML) in the C-terminal region of IFN-γ5. To investigate whether the Noc2 protein in TM has a similarly form of molecular
mimicry that could trigger the development of AIGAs, we searched in NCBI BLAST for sequences displaying homology to P123–135, which sequence was unique to IFN-γ in humans. Surprisingly, the
P123–135 epitope had 80%-positive homology to amino acids 98–107 (AKTGKRKRID) of the ribosome assembly protein Noc2 of TM. At the same time, the two sequences are similar in spatial
structure. This region in Noc2 is highly conserved across all of the species in the databases (UniProt). Therefore, when infected with NTM, TM, _Aspergillus_, and other pathogens with Noc2
sequences, cross-reactivity with Noc2 might occur, stimulating the production of AIGAs, leading to further impaired immunity. In the present study, the AIGA-positive titer of patients with
co-infection and multiple infections was significantly higher than that in AIGA-negative patients. Moreover, the AIGA titer was significantly positively correlated with the number of
pathogens that infected the patients. These findings are consistent with those of previous studies and our hypothesis. However, further investigation is required to determine whether the
AIGA titer positively correlates with the number of pathogens or the Noc2 level. As the clinical manifestations and recurrent opportunistic infection of AOID are similar to those if AIDS,
AOID caused by AIGAs has previously been defined as an “AIDS-like syndrome”9,10. However, the mechanisms of immune deficiency between them are completely different. Previously, studies have
found that persistent exposure to antigen continuously stimulates T lymphocytes leading to prolonged inflammation. During chronic infections, memory T lymphocytes enter an entirely different
differentiation program that ends in T cell exhaustion11,12. Here, the CD4+ T cell count was lower in AIGA-positive patients than in AIGA-negative patients. Meanwhile, there was a
significant negative correlation between the AIGA titer and CD4+ T cell count. These may be related to the following reasons. First, post-infection immunosuppression. The CD4+ T cell count
was selected during the active stage of infection. Co-infection and multiple, persistent, and disseminated infections were more common in AIGA-positive patients than in AIGA-negative
patients. Second, because of its ability to regulate various protective functions and sustain the activity of both CD4+ and CD8+T cells, IFN-γ is essential for fighting infections13. Third,
AIGAs can underlie IFN-γ dysfunction by inhibiting STAT1 phosphorylation, interleukin-12 production, and severe dysfunction of the Th1 response1,7,14 and affect the differentiation of CD4+ T
cell subsets, leading to a decrease in Th1 cell differentiation and proliferation. Thus, there may be a vicious circle among these factors, severe co-infection, multiple, persistent, and
disseminated infections, AIGA titer, and CD4 + T cells level. This observation in our study is consistent with those of previous studies, including the study of Browne et al.1. CONCLUSIONS
This study provides the first evidence that high globulin and IgG levels, low CD4+T levels, double or multiple infections, and disseminated infections could be potentially effective
predictive factors for AIGA positivity in HIV-negative patients with TM and/or NTM infections. Monitoring and predicting the AIGA titer is crucial to assess patient prognosis and host
immunodeficiency severity. Methods for detecting AIGAs, including ELISA, particle-based assay, and flow cytometry, should be widely used in the clinical setting. A feasible, precise, and
standardized protocol should be established to improve the diagnosis of AIGA in clinical practice. This study had some limitations. First, this study was a multicenter retrospective study
conducted in Guangxi, China, and its conclusions may not apply to other countries and provinces. The sample size was too small to perform multivariate analysis. However, this study makes a
novel contribution to the literature by comparing AIGA-positive and AIGA-negative patients to elucidate the clinical significance of AIGAs and screening existing clinical indicators to
identify potential predictors of AIGA for timely identification of AIGA positivity to evaluate host immunity and improve prognosis. METHODS We performed this multicenter prospective cohort
study in Guangxi Province in the south of China between January 1, 2017, and December 31, 2019, from 13 centers [(1) The Eighth Affiliated Hospital of Sun Yat-Sen University; (2) The First
Affiliated Hospital of Guangxi Medical University; (3) The Affiliated Tumor Hospital of Guangxi Medical University; (4) The Second Affiliated Hospital of Guangxi Medical University; (5) The
Hospital of Guangxi Zhuang Autonomous Region; (6) Nan Xishan Hospital of Guangxi Zhuang Autonomous Region; (7) Nanning Second People's Hospital; (8) Nanning Fourth People's
Hospital; (9) Nanning Eighth People's Hospital; (10) Yiyang Central Hospital; (11) Liuzhou First People's Hospital; (12) Guigang First People's Hospital; and (13) Guilin First
People's Hospital]. We selected and collected peripheral blood serum from patients with fungal and bacterial infections (tuberculosis, NTM, TM, NTM, cryptococcus and other bacterial
infections) during the study period. After detecting AIGA in the serum, we assigned patients into the AIGA positive group and AIGA negative group according to AIGA titers. Participants with
AIGA titers exceeding the 99th percentile of the 103 healthy controls were defined as AIGA-positive. To eliminate selection bias, after matching the patients’ sex, age, HIV and the type of
pathogenic microorganism infection, we assigned patients into the AIGA negative group from AIGA negative patients. We excluded participants less than 18 years of age; those with autoimmune
disease, cancer, or immunodeficiency; or those who had received immunosuppressive medications in the past 3 months. Finally, we enrolled 63 AIGA-positive (group 1) and 29 AIGA-negative
(group 2) patients with TM and NTM infections. Demographic and clinical data were recorded in standardized forms. The comparison of biomarkers or clinical parameters between the groups was
performed at the active infection stage. All patients were followed-up until October 1, 2020, or until the time of death. The clinical course of the infected patients was classified into the
following four categories: cured (no recurrence of infection for at least 6 months after the discontinuation of antimicrobial therapy); persistent infection (no improvement of clinical
symptoms after antimicrobial therapy); relapse infection (improvement of clinical symptoms, negative pathogen detection after antimicrobial therapy, followed by the reappearance of
pathogen-associated infectious signs and/or positive pathogen testing); and death15. Disseminated disease was defined as an infection in two noncontiguous and sterile sites. Antimicrobial
therapies included antifungal, anti-NTM, anti-tuberculosis, and anti-bacterium therapies. This study was approved by the Ethical Review Committee of the First Affiliated Hospital of Guangxi
Medical University (2020.KY-E-044). Written informed consent was provided by all participants enrolled in this study. DIAGNOSTIC CRITERIA FOR NTM, TM, AND OTHER PATHOGENIC INFECTIONS Each
patient fulfilled the diagnostic criteria for each disease. TM infection was diagnosed as follows: 1) positive cultures of TM, characterized by dimorphic fungi that grew as a mold at 25 °C
and yeast at 37 °C; 2) characteristic morphology of the yeast form of TM, confirmed by cytology and histopathology from tissues and secretions by Periodic Acid–Schiff staining or Wright’s
staining, including a transverse septum7,15; or 3) TM isolated by metagenomic next-generation sequencing from clinical specimens. NTM was diagnosed following the 2007 American Thoracic
Society (ATS)/Infectious Disease Society of America guidelines16. Positive cultures, cytology, and histopathology of the clinical specimens were used to diagnose _S. aureus_, _Aspergillus_,
_Salmonella_, _Burkholderia_, as well as _Candida albicans_, _Klebsiella pneumoniae_, _Providencia rettgeri_, and _Citrobacter_ infections. HEALTHY VOLUNTEER INCLUSION CRITERIA Healthy
volunteers were enrolled over the same period. Healthy volunteers were defined as individuals without infection, underlying diseases, immunodeficiency conditions (diseases that could lead to
or are associated with immunosuppression), including autoimmune diseases, malignancy, and primary immunodeficiency, or chronic diseases such as chronic renal failure, liver cirrhosis,
diabetes mellitus, hypertension, or solid organ transplantation. Moreover, only those who had not received glucocorticoid and/or immunosuppressive therapy were included. One hundred three
healthy volunteers with normal routine blood and chest radiography findings were recruited from the health checkup center in The First Affiliated Hospital of Guangxi Medical University. All
participants were HIV-negative. AIGA ASSAY Serum samples were obtained under sterile conditions before the patients received antimicrobial therapy and during the active stage of infection.
Serum samples were retrieved from a serum bank and stored at − 80 °C. AIGAs were detected in all participants. All serum samples were tested at the first thaw. The detection of AIGAs was
performed using an ELISA kit (Cloud-Clone Corp., Wuhan, China), whose detection range is 12–200 ng/ml. According to the manufacturer’s protocols, the serum samples from patients were 1:1500
diluted, and serum samples from a healthy control were 1:600 diluted by phosphate-buffered saline (PBS)15. The normal range for the anti-IFN-γ-autoantibody concentration was defined by the
99th percentile for the 103 healthy controls and was estimated using log-normal distribution. Outlying concentrations were classified as positive for anti-IFN-γ autoantibodies1,6,15.
STATISTICAL ANALYSIS Data are expressed as median ± interquartile range. Differences between groups were compared using Kruskal–Wallis H or Mann–Whitney U test. Dunn–Bonferroni test was used
for post-hoc analysis. Chi-square or Fisher’s exact test was used to compare categorical variables. Pearson correlation analysis was used for the correlation between AIGAs and clinical
indices. Univariate logistic regression analysis was used for predicting factors of AIGA positivity. The normal range for the AIGA concentration was defined by the 99th percentile for the
103 healthy controls and was estimated using log-normal distribution. Outlying concentrations were classified as positive for AIGAs1,6. We used SPSS (version 25.0) and GraphPad Prism
(version 7, La Jolla, CA, USA) for statistical analysis and preparing graphs. Results with _P_ < 0.05 were considered significant. ETHICS APPROVAL AND CONSENT TO PARTICIPATE This study
was approved by the Ethical Review Committee of the First Affiliated Hospital of Guangxi Medical University (2020.KY-E-044). Written informed consent was provided by all participants in the
prospective cohort study. All patients were followed-up until July 1, 2020, or until the date of death. All methods were carried out in accordance with the Declaration of Helsinki guidelines
and regulations. DATA AVAILABILITY The datasets used or analyzed during the current study are available from the corresponding author on reasonable request. ABBREVIATIONS * BMI: Body mass
index * AIGA: Anti-IFN-γ autoantibody * ND: Not done * HLA: Human leukocyte antigen * WBC: White blood cell * N: Neutrophil count * L: Lymphocyte count * HGB: Hemoglobin * ESR: Erythrocyte
sedimentation rate * CRP: C-reactive protein * Ig: Immunoglobulin REFERENCES * Browne, S. K. _et al._ Adult-onset immunodeficiency in Thailand and Taiwan. _N. Engl. J. Med._ 367, 725–734
(2012). Article CAS Google Scholar * Hong, G. H. _et al._ Natural history and evolution of anti-interferon-γ autoantibody-associated immunodeficiency syndrome in Thailand and the United
States. _Clin. Infect. Dis._ 71(1), 53–62 (2020). Article CAS Google Scholar * Qiu, Y., Feng, X., Zeng, W., Zhang, H. & Zhang, J. Immunodeficiency disease spectrum in HIV-negative
individuals with talaromycosis. _J. Clin. Immunol._ 41(1), 221–223 (2021). Article Google Scholar * Chi, C. Y. _et al._ Anti-IFN-γ autoantibodies in adults with disseminated nontuberculous
mycobacterial infections are associated with HLA-DRB1*16:02 and HLA-DQB1*05:02 and the reactivation of latent varicella-zoster virus infection. _Blood_ 121(8), 1357–1366 (2013). Article
CAS Google Scholar * Lin, C. H. _et al._ Identification of a major epitope by anti-interferon-γ autoantibodies in patients with mycobacterial disease. _Nat. Med._ 22(9), 994–1001 (2016).
Article CAS Google Scholar * Zeng, W. _et al._ Characterization of anti-interferon-γ antibodies in HIV-negative patients infected with disseminated _Talaromyces marneffei_ and
Cryptococcosis. _Open Forum Infect. Dis._ 6(10), ofz208 (2019). Article Google Scholar * Shih, H. P., Ding, J. Y., Yeh, C. F., Chi, C. Y. & Ku, C. L. Anti-interferon-γ
autoantibody-associated immunodeficiency. _Curr. Opin. Immunol._ 72, 206–214 (2021). Article CAS Google Scholar * Patel, S. Y. _et al._ Anti-IFN-gamma autoantibodies in disseminated
nontuberculous mycobacterial infections. _J. Immunol._ 175(7), 4769–4776 (2005). Article CAS Google Scholar * Chruewkamlow, N. _et al._ Immune alterations in patients with
anti-interferon-γ autoantibodies. _PLoS ONE_ 11(1), e0145983 (2016). Article Google Scholar * Dan, Li., Hui, X., Hua, L. & Yiming, S. Research progress in adult-onset immunodeficiency.
_Chin. J. AIDS STD._ 19(4), 311–313 (2013). Google Scholar * Wherry, E. J. & Kurachi, M. Molecular and cellular insights into T cell exhaustion. _Nat. Rev. Immunol._ 15, 486–499
(2015). Article CAS Google Scholar * Fenninger, F. _et al._ Mutation of an L-type calcium channel gene leads to T lymphocyte dysfunction. _Front. Immunol._ 10, 2473 (2019). Article CAS
Google Scholar * Kak, G., Raza, M. & Tiwari, B. K. Interferon-gamma (IFN-γ): Exploring its implications in infectious diseases. _Biomol. Concepts_ 9(1), 64–79 (2018). Article CAS
Google Scholar * Chi, C. Y. _et al._ Clinical manifestations, course, and outcome of patients with neutralizing anti-interferon-γ autoantibodies and disseminated nontuberculous
mycobacterial infections. _Medicine (Baltimore)_ 95(25), e3927 (2016). Article CAS Google Scholar * Qiu, Y. _et al._ _Talaromyces marneffei_ and nontuberculous mycobacteria co-infection
in HIV-negative patients. _Sci. Rep._ 11(1), 16177 (2021). Article ADS CAS Google Scholar * Griffith, D. E. _et al._ An official ATS/IDSA statement: Diagnosis, treatment, and prevention
of nontuberculous mycobacterial diseases. _Am. J. Respir. Crit. Care Med._ 175(4), 367–416 (2007). Article CAS Google Scholar Download references ACKNOWLEDGEMENTS This work was supported
by grants from the Natural Science Foundation of China [NSFC81760010 and 82060364], the Science and Technology Department of Guangxi Zhuang Autonomous Foundation of Guangxi Key Research and
Development Program (No. GuikeAB20238025 and No. GuikeAB16380228), and Guangxi Natural Science Foundation (NO. 2021GXNSFBA220064). AUTHOR INFORMATION Author notes * These authors contributed
equally: Ye Qiu, Mengxin Tang and Wen Zeng. AUTHORS AND AFFILIATIONS * Department of Respiratory and Critical Medicine, The Eighth Affiliated Hospital, Sun Yat-Sen University, Shenzhen,
518000, Guangdong, China Ye Qiu, Mengxin Tang, Xin Feng, Mianluan Pan & Jianquan Zhang * State Key Laboratory of Respiratory Disease, National Clinical Research Center for Respiratory
Disease, The First Affiliated Hospital of Guangzhou Medical University, Guangzhou, 510120, China Ye Qiu * Department of Respiratory and Critical Medicine, The First Affiliated Hospital of
Guangxi Medical University, Nanning, 530021, Guangxi, China Ye Qiu, Mengxin Tang, Wen Zeng & Xin Feng * Department of Nephrology, The Second Affiliated Hospital of Guangxi Medical
University, Nanning, 530021, Guangxi, China Wei Li Authors * Ye Qiu View author publications You can also search for this author inPubMed Google Scholar * Mengxin Tang View author
publications You can also search for this author inPubMed Google Scholar * Wen Zeng View author publications You can also search for this author inPubMed Google Scholar * Xin Feng View
author publications You can also search for this author inPubMed Google Scholar * Mianluan Pan View author publications You can also search for this author inPubMed Google Scholar * Wei Li
View author publications You can also search for this author inPubMed Google Scholar * Jianquan Zhang View author publications You can also search for this author inPubMed Google Scholar
CONTRIBUTIONS Y.Q. conceived and designed the study; acquired, analyzed, and interpreted the data; drafted the manuscript. J.Z. conceived of the study and critically revised the manuscript
for important intellectual content. X.F. and M.T. analyzed and interpreted the data. W.L. conceived of the study and revised the manuscript. M.P. acquired and analyzed the data and agreed to
be accountable for all aspects of the work in ensuring that questions related to the accuracy or integrity of any part of the work are appropriately investigated and resolved. Y.Q. and W.Z.
agreed to be accountable for all aspects of the work in ensuring that questions related to the accuracy and integrity of any part of the work are appropriately investigated and resolved.
All authors read and approved the final manuscript. CORRESPONDING AUTHORS Correspondence to Wei Li or Jianquan Zhang. ETHICS DECLARATIONS COMPETING INTERESTS The authors declare no competing
interests. ADDITIONAL INFORMATION PUBLISHER'S NOTE Springer Nature remains neutral with regard to jurisdictional claims in published maps and institutional affiliations. RIGHTS AND
PERMISSIONS OPEN ACCESS This article is licensed under a Creative Commons Attribution 4.0 International License, which permits use, sharing, adaptation, distribution and reproduction in any
medium or format, as long as you give appropriate credit to the original author(s) and the source, provide a link to the Creative Commons licence, and indicate if changes were made. The
images or other third party material in this article are included in the article's Creative Commons licence, unless indicated otherwise in a credit line to the material. If material is
not included in the article's Creative Commons licence and your intended use is not permitted by statutory regulation or exceeds the permitted use, you will need to obtain permission
directly from the copyright holder. To view a copy of this licence, visit http://creativecommons.org/licenses/by/4.0/. Reprints and permissions ABOUT THIS ARTICLE CITE THIS ARTICLE Qiu, Y.,
Tang, M., Zeng, W. _et al._ Clinical findings and predictive factors for positive anti-interferon-γ autoantibodies in patients suffering from a non-tuberculosis mycobacteria or _Talaromyces
marneffei_ infection: a multicenter prospective cohort study. _Sci Rep_ 12, 9069 (2022). https://doi.org/10.1038/s41598-022-13160-x Download citation * Received: 04 September 2021 *
Accepted: 06 May 2022 * Published: 31 May 2022 * DOI: https://doi.org/10.1038/s41598-022-13160-x SHARE THIS ARTICLE Anyone you share the following link with will be able to read this
content: Get shareable link Sorry, a shareable link is not currently available for this article. Copy to clipboard Provided by the Springer Nature SharedIt content-sharing initiative