Differentiation of recurrent glioblastoma from radiation necrosis using diffusion radiomics with machine learning model development and external validation
- Select a language for the TTS:
- UK English Female
- UK English Male
- US English Female
- US English Male
- Australian Female
- Australian Male
- Language selected: (auto detect) - EN
Play all audios:
ABSTRACT The purpose of this study was to establish a high-performing radiomics strategy with machine learning from conventional and diffusion MRI to differentiate recurrent glioblastoma
(GBM) from radiation necrosis (RN) after concurrent chemoradiotherapy (CCRT) or radiotherapy. Eighty-six patients with GBM were enrolled in the training set after they underwent CCRT or
radiotherapy and presented with new or enlarging contrast enhancement within the radiation field on follow-up MRI. A diagnosis was established either pathologically or clinicoradiologically
(63 recurrent GBM and 23 RN). Another 41 patients (23 recurrent GBM and 18 RN) from a different institution were enrolled in the test set. Conventional MRI sequences (T2-weighted and
postcontrast T1-weighted images) and ADC were analyzed to extract 263 radiomic features. After feature selection, various machine learning models with oversampling methods were trained with
combinations of MRI sequences and subsequently validated in the test set. In the independent test set, the model using ADC sequence showed the best diagnostic performance, with an AUC,
accuracy, sensitivity, specificity of 0.80, 78%, 66.7%, and 87%, respectively. In conclusion, the radiomics models models using other MRI sequences showed AUCs ranging from 0.65 to 0.66 in
the test set. The diffusion radiomics may be helpful in differentiating recurrent GBM from RN. . SIMILAR CONTENT BEING VIEWED BY OTHERS MACHINE LEARNING BASED DIFFERENTIATION OF GLIOBLASTOMA
FROM BRAIN METASTASIS USING MRI DERIVED RADIOMICS Article Open access 18 May 2021 PREDICTING HISTOLOGICAL GRADE IN PEDIATRIC GLIOMA USING MULTIPARAMETRIC RADIOMICS AND CONVENTIONAL MRI
FEATURES Article Open access 13 June 2024 MRI RADIOMICS BASED ON MACHINE LEARNING IN HIGH-GRADE GLIOMAS AS A PROMISING TOOL FOR PREDICTION OF CD44 EXPRESSION AND OVERALL SURVIVAL Article
Open access 03 March 2025 INTRODUCTION The current gold standard treatment for glioblastoma (GBM, World Health Organization [WHO] grade IV) is maximum safe tumor resection, followed by
concurrent chemoradiotherapy (CCRT) with temozolomide1,2. In cases of elderly patients with unmethylated 6-methylguanine-DNA methyltransferase (MGMT) promoter status or patients with
Karnofsky performance status (KPS) index lower than 70, radiotherapy (RT) alone is the standard treatment2,3. Radiation necrosis (RN) usually occurs within 3 years after radiation therapy
and is often indistinguishable from recurrent tumor because it manifests as an enhancing mass lesion with varying degrees of surrounding edema and progressive enhancement on serial magnetic
resonance imaging (MRI)4,5. Thus, distinguishing between recurrent GBM and RN has clinical importance in deciding the subsequent management; recurrence indicates treatment failure and
requires the use of additional anticancer therapies, whereas RN is treated conservatively. Multiple studies have made efforts to distinguish GBM recurrence from RN using various imaging
methods, including conventional imaging, diffusion-weighted imaging (DWI), diffusion tensor imaging, dynamic susceptibility contrast (DSC) imaging, MR spectroscopy, amide proton transfer
imaging, and positron emission tomography4,5,6,7,8,9,10,11,12,13. However, there is no gold standard imaging method for the differentiation between recurrence and RN, due to high degree of
overlapping findings. Currently, the definitive diagnosis is based on histopathology which is both invasive and difficult. In addition, the pathology results may be variable depending on the
surgical sampling sites due to the coexistence and admixture of recurrence and RN14. Radiomics involves the identification of ample quantitative features within images and the subsequent
data mining for information extraction and application15. Recent studies have shown promising results in predicting the molecular status, grade, and prognosis of gliomas16,17,18,19,20.
Because radiomics models use high-throughput features, there are prone to discover invisible information which are inaccessible with single-parameter analysis. The aim of this study was to
develop and validate a high-performing radiomic strategy using machine learning classifiers from conventional imaging and apparent diffusion coefficient (ADC) to differentiate recurrent GBM
from RN after concurrent CCRT or radiotherapy. RESULTS BASELINE CHARACTERISTICS OF THE PATIENTS The baseline demographic and clinical characteristics are summarized in Table 1. Of the 86
patients in the training set, 63 (73.3%) were classified as recurrent GBM and 23 (26.7%) as RN cases. The 41 patients in the test set consisted of 23 (56.1%) recurrent GBM and 18 (43.9%) RN
cases. There were no significant differences in age, sex, extent of resection, first line treatment (either CCRT or RT alone/RT plus temozolomide), total radiation dose, isocitrate
dehydrogenase 1 (IDH1) mutation status, and MGMT methylation status between patients with recurrent GBM and those with RN within both training and test sets. QUALITATIVE IMAGING ANALYSIS The
radiologists’ assessment of conventional imaging features showed no significant difference between recurrent GBM and RN in maximum lesion diameter, involvement of corpus callosum, and
“Swiss cheese” or “spreading wavefront” enhancement pattern in both the training set and test sets (all p-values > 0.05), respectively. BEST PERFORMING MACHINE LEARNING MODELS FROM
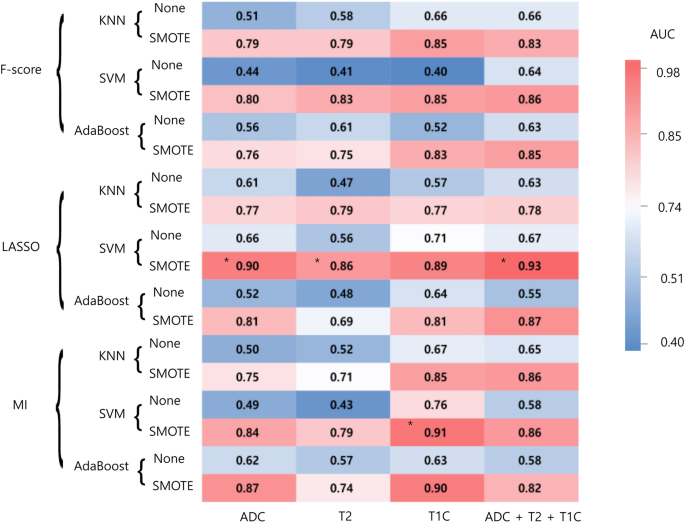
RADIOMICS FEATURES FOR DIFFERENTIATING RECURRENT GBM FROM RN IN THE TRAINING SET Using radiomic features, in each combination of the selected MRI sequence, the 3 feature selection, 3
classification methods, and 2 oversampling methods were trained. The performance of each combination of the models is shown in Fig. 1. In the training set, the area under the curve (AUCs) of
the models showing the best diagnostic performance ranged from 0.86 to 0.93 in each combination. AUCs with oversampling were higher than those without oversampling in all combinations. In
the ADC sequence, the combination of least absolute shrinkage and selection operator (LASSO) feature selection, and support vector machine (SVM) showed the best diagnostic performance in the
training set. The selected 18 features consisted of 3 first-order features, 10 s-order features, and 5 shape features (Detailed information at Supplementary Table 3). This model
demonstrated an area under the curve (AUC), accuracy, sensitivity, specificity of 0.90 (95% confidence interval [CI] 0.84–0.95), 80.5%, 78.3%, and 82.9%, respectively. In the T2WI (T2)
sequence, the combination of LASSO feature selection and SVM showed the best diagnostic performance in the training set with an AUC of 0.86 (95% CI 0.80–0.91). In the postcontrast T1WI (T1C)
sequence, the combination of mutual information (MI) feature selection and SVM showed the best diagnostic performance in the training set with an AUC of 0.91 (95% CI 0.86–0.95). In the
combined sequence (ADC + T2 + T1C), the combination of LASSO feature selection, and SVM showed the best diagnostic performance in the training set with an AUC of 0.93 (95% CI 0.89–0.97).
(Hyperparameters for each model are summarized at Supplementary Table 4). ROBUSTNESS OF RADIOMICS MODELS IN THE TEST SET In the independent test set, the model using ADC sequence with the
combination of LASSO feature selection and SVM showed the best diagnostic performance. This model demonstrated an AUC, accuracy, sensitivity, specificity of 0.80 (95% CI 0.65–0.95), 78%,
66.7%, and 87%, respectively. The radiomics models using other combination of MRI sequence showed poor performance (AUCs ranging from 0.65 to 0.66) in the test set, although it did not reach
significant difference from the ADC radiomics model (p-values of > 0.05). Table 2 summarizes the results of best performing models in training and test sets. DISCUSSION In this study, we
evaluated the ability of conventional and diffusion radiomics to differentiate recurrent GBM from RN. Several MR sequences and their combination were investigated and validated externally,
and among these models the diffusion radiomics model showed robustness with AUC of 0.80. RN has been reported to occur in approximately 9.8–44.4% of treated gliomas, which shows low
incidence than recurrent GBM6,9,21. In our study, the data imbalance was mitigated by using a systematic algorithm, which generates synthetic samples in the minority class22. The performance
was increased when synthetic minority over-sampling technique (SMOTE) was applied in our dataset (Fig. 1), showing its efficacy. Although recurrent GBM and RN have similar radiologic
appearances, they harbor distinct radiomic information that can be extracted and used to build a clinically relevant predictive model that discriminates recurrent GBM from RN. Our model may
aid in deciding the subsequent management of these patients. Although conventional findings such as “Swiss cheese” or “spreading wavefront” enhancement pattern have been reported to show
differences between recurrent high-grade glioma and RN in earlier studies5,6, these findings have subsequently been reported that they cannot be reliably used alone in differentiating
between the two conditions4,23. Moreover, these conventional imaging patterns are highly subjective. Various studies implementing advanced imaging parameters such as diffusion MRI, DSC MRI,
proton MR spectroscopy (MRS), amide proton transfer (APT) imaging, and positron emission tomography (PET) have shown promising results in differentiating recurrent GBM from
RN9,11,12,24,25,26. Although APT imaging has shown higher diagnostic performance than MRS27 or 11C-MET PET28 in differentiating recurrent GBM from RN, APT imaging is challenging due to long
scan times and limited coverage with high radiofrequency power. On the other hand, the accuracy of MRS and PET in differentiating recurrent GBM from RN has been questioned; a meta-analysis
has shown moderate sensitivity and specificity for MRS, 18F-FDG, and 11C-MET PET in distinguishing between recurrent GBM from RN29, whereas another study found no difference between
recurrence and necrosis groups using 18F-FDG and 11C-MET PET12. MRS and PET also have limited value in practical clinical settings due to their limited availability and low
cost-effectiveness. DSC MRI can readily distinguish between recurrent GBM and RN, as a biomarker of angiogenesis, with higher availability9,30. However, the relative cerebral blood volume
from DSC MRI can produce false positive or false negative results due to volume averaging, susceptibility artifacts, and overlapping portions in RN and recurrent GBM4,31. Also, the optimal
thresholds are different depending on the specific protocol9,32, and values derived from DSC imaging are relative values compared to absolute values from ADC maps. Moreover, the previous
studies using advanced imaging focused on single parameters such as mean values. In contrast to extraction of single parameters, radiomics extracts high-throughput quantitative features
within the regions of interest and has been reported to be a potentially useful approach for estimating the molecular status, grade, and prognosis of brain tumors16,17,19,20,33,34. Previous
studies have showed promising results in identifying recurrent brain tumor from RN using radiomics35,36,37. However, these studies were focused on recurrent brain metastases rather than
recurrent GBM, analyzing only conventional MRI sequences, and most datasets were small without external validation. Recent studies implemented radiomics model in differentiating recurrent
glioma from RN38,39; however the studies was either performed in a smaller dataset without external validation using only conventional MRI38, or performed radiomics analysis using 18F-FDG
and 11C-MET PET39, which are not routinely acquired imaging modalities. Our radiomics model implemented not only conventional MRI but also ADC map, which are recommended sequences in the
glioma protocol40,41, and showed that diffusion radiomics model could robustly differentiate recurrent GBM from RN better than any other radiomics model. However, models using conventional
MRI sequences (such as T2 or T1C) showed AUCs ranging from 0.650 to 0.662 in the test set. Moreover, multiparametric radiomics model did not show increased performance than the diffusion
radiomics model in the external validation. The signal intensities in conventional images may differ in different MRI protocol settings, leading to poor performance in an external validation
even after signal intensity normalization. On the other hand, ADC maps extract absolute values creating reliable feature extraction, which may be less affected by heterogeneous protocol
settings and consequently demonstrated high diagnostic performance in the external validation. In addition, our results may emphasize the importance of domain-specific knowledge in the
relatively small data settings of radiomics study42. Previous studies have shown that the ADC characteristics are more important than conventional characteristics in differentiating RN from
GBM4,7. The diffusion radiomics model is promising for reflecting the tumor microenvironment, since these values can contain biological information43,44. Although ADC value can be affected
by various factors, ADC in tumor is generally considered to be an index of tumor cellularity that reflects tumor burden45,46. On histopathological examination, recurrent GBM is characterized
by dense glioma cells, which limit water diffusion7. In contrast, RN is characterized by extensive fibrinoid necrosis, vascular dilatation, and gliosis47. The different histopathology and
spatial complexity may be reflected in diffusion radiomics, allowing the differentiation of the two entities31. In our study, the majority of significant radiomics features from the
diffusion radiomics model were various second-order features, suggesting that high‐throughput characteristics can provide more accurate assessment. The hypothesis for this observation is
that second-order features capture the spatial variation in signal intensity, which tend to extract information that may be incomprehensible and invisible to the naked eye. Recent studies
have demonstrated that second-order features also reflect the underlying histology48,49. However, a future study with histopathologic correlation is mandatory to prove our hypothesis of the
direct relationship between radiomic features in recurrent GBM and RN. Various features such as flatness, sphericity, mesh volume, and major axis length were included, suggesting that the
quantitative shape features may aid in differentiating in recurrent GBM from RN. Because there was no previous study that has quantified various shape features from the whole 3D lesion,
further studies are indicated to validate our results. Our study has several limitations. First, our study was retrospective with a small data size. Due to the relatively small size of the
test set, the 95% CIs of the AUCs in the test set tended to have a large range and some 95% CIs of the radiomics models cross 0.5. Future studies should be performed with a larger dataset.
Second, DSC imaging was not included due to lack of data in a portion of patients. Because DSC data is important in distinguishing recurrent GBM from RN50, further radiomics studies
implementing DSC data are warranted to evaluate the efficacy. Third, fluid-attenuation inversion recovery (FLAIR) sequence was not utilized in this study due to mixture of both precontrast
and postcontrast FLAIR sequences in the training set. Further studies are warranted to include the FLAIR sequence in radiomics analysis. Fourth, clinical factors were not integrated into the
radiomics model due to statistical insignificance in our dataset. However, as previous studies have stated the relationship between radiation doses or fractionation schemes with RN51,52,
future radiomics studies with larger datasets should perform multivariable analysis with clinically relevant features to differentiate recurrent GBM from RN. Fifth, cross-validation was
performed separately in the feature selection stage and the machine learning classification stage, which may have led to overfitted results. In conclusion, the diffusion radiomics model may
be helpful in differentiating recurrent GBM from RN. METHODS PATIENT POPULATION The Yonsei University Institutional Review Board waived the need for obtaining informed patient consent for
this retrospective study. All methods were carried out in accordance with relevant guidelines and regulation. For research limited to patients' medical records, access was cleared by
the Yonsei University Institutional Review Board and was supervised by a person (S-K.L.) who was fully aware of the confidentiality requirements. All of the study protocols were approved by
the Institutional Review Board (Severance Hospital, Yonsei University Health System Institutional Review Board, 2018-1472-002). Between February 2016 and February 2019, 90 patients with
pathologically diagnosed GBM (WHO grade IV) from our institution were reviewed in this study. The inclusion criteria were as follows: (1) GBM confirmed by histopathology; (2) postoperative
CCRT or RT, with a radiation dose ranging from 45 to 70 Gy; (3) subsequent development of a new or enlarging region of contrast enhancement within the radiation field 12 weeks after CCRT or
RT; and (4) surgical resection of the enhancing lesion or adequate clinicoradiological follow-up, which enabled us to diagnose recurrent GBM or RN. For clinicoradiological diagnosis, a final
diagnosis of recurrent GBM was made if the contrast-enhancing lesions gradually enlarged on more than two subsequent follow-up MRI studies performed at 2–3 month intervals (with a size
criterion of an increase of > 25% of the size of a measurable [> 1 cm] enhancing lesion according to the sum of the products of perpendicular dimensions) and the clinical symptoms of
patients showed gradual deterioration during follow-up28. Alternatively, a final diagnosis of RN was made if enhancing lesions gradually decreased on more than two subsequent follow-up MRI
studies performed at 2–3 month intervals and clinical symptoms improved during the follow-up period. Exclusion criteria were as follows: (1) processing error (n = 3), (2) absence of MRI
sequences (n = 1). Thus, a total of 86 patients were enrolled. Identical inclusion and exclusion criteria were applied and 41 patients from another institutional hospital (Asan Medical
Center, Seoul, Korea) were enrolled in the test set. The clinical characteristics of the patients included age, sex, KPS, IDH mutational status, MGMT promoter methylation status, and the
extent of resection of the tumor (gross total resection, subtotal resection, partial resection, or biopsy). PATHOLOGICAL DIAGNOSIS All patients underwent initial surgery, and histologic
confirmation was obtained according to the 2016 WHO classification46. Peptide nucleic acid-mediated clamping polymerase chain reaction and immunohistochemical analysis were performed to
detect the R132H mutation status in IDH153. MGMT promoter methylation status was diagnosed on the basis of methylation-specific polymerase chain reaction54. Twenty-two and 14 patients
underwent second-look operations in the training set and test set, respectively. In second-look operations, the pathological diagnoses included 17 recurrent GBM and 5 RN cases in the
training set, and 8 recurrent GBM and 6 RN cases in the test set, respectively. The diagnosis was made on the basis of histological findings in contrast-enhancing tissue obtained with
surgical tumor resection or image-guided. More than 5% viable tumor diagnosed during the histological examination by neuropathologists, were classified as a recurrent GBM9. MRI PROTOCOL In
the training set, all patients underwent MRI on a 3.0-T MRI scanner (Achieva or Ingenia, Philips Medical Systems) with an 8-channel head coil. The preoperative MRI sequences included T1WI,
T2, T1C, as well as ADC scans. After 5–6 min of administration of 0.1 mL/kg of gadolinium-based contrast material (Gadovist; Bayer), T1C were acquired. In the external validation set, MRI
exams were performed using a 3.0-T MRI scanner (Achieva, Philips Medical Systems) with an 8-channel head coil. Scaling and un-normalization of ADC pixel values generated at the scanner was
performed as previously described55. Constant level appearance (CLEAR) processing, a technique to achieve homogeneity correction by using coil sensitivity maps acquired in the reference
scan, was performed55. The acquisition protocols are described in further details in the Supplementary Table 1. QUALITATIVE IMAGE ANALYSIS Conventional images were analyzed by two
neuroradiologists (with 14 years and 7 years of experience) for maximum lesion diameter, involvement of corpus callosum, and “Swiss cheese” or “spreading wavefront” (ill-defined margins of
the enhancement) enhancement pattern, according to previous literature5,6. Discrepancies were settled by consensus. IMAGE PREPROCESSING AND RADIOMICS FEATURE EXTRACTION Preprocessing of T2,
T1C images, and ADC map was performed to standardize the data analysis among patients. Low-frequency intensity nonuniformity was corrected by applying the N4 bias correction algorithm as
implemented in the Advanced Normalization Tools (ANTs)56. Signal intensity normalization was used to reduce variance in the T2 and T1C images, by applying the WhiteStripe method from R
package57. T2, T1C, and ADC images were resampled to a uniform voxel size of 1 × 1 × 1 mm. T2 and ADC images were registered to the T1C image using affine transformation with normalized
mutual information as a cost function. Tumor segmentation was performed through a consensus discussion of two neuroradiologists (with 14 years and 7 years of experience), in order to select
the contrast-enhancing solid portion of the tumor on T1C images. Segmentation was performed semiautomatically with an interactive level-set region of interest, using edge-based and
threshold-based algorithms using 3D Slicer (version 4.11.0). There was no distortion in the ADC images that affected the segmented masks. Radiomic features were extracted from the segmented
mask, with a bin size of 32, with an open-source python-based module (PyRadiomics, version 2.0)58, which was adherent to the Image Biomarker Standardization Initiative (IBSI) guideline59. A
total of 93 radiomic features, including shape, first order features, and second-order features (Supplementary Table 2), were extracted from the mask. In addition, edge contrast calculation
was performed, that characterizes the tumor border, as previously described (Supplementary Information S1)60. The final set consisted of 263 radiomic features (14 shape features + 83
first-order and second-order 14 features × 3 sequences) for each patient. The data were processed using a multi-platform, open-source software package (3D slicer, version 4.6.2-1;
http://slicer.org). STATISTICAL ANALYSIS Baseline characteristics were compared between recurrent GBM and RN patients using chi-squared or Fisher’s exact test for categorical variables,
independent _t_-tests for normally distributed continuous variables, and Mann–Whitney _U_-tests for continuous variables without normal distribution. DeLong’s method was used to compare the
AUCs among the ADC radiomics model and other radiomics models in the training and test sets61. Statistical significance was set at P < 0.05. RADIOMIC FEATURE SELECTION AND MACHINE
LEARNING The schematic of the radiomics pipeline is shown in Fig. 2. All radiomic features were normalized using z-score normalization. For feature selection, the F-score, LASSO, or MI with
stratified ten-fold cross-validation were applied62. After feature selection, the machine learning classifiers were constructed separately using k-nearest neighbors (KNN), SVM, or AdaBoost,
with stratified ten-fold cross-validation. The optimal hyperparameters producing the highest AUC were selected by random search during cross-validation and subsequently used to get the final
model. In addition, to overcome data imbalance, each machine learning model was trained either without oversampling or with SMOTE (with a 1:1 ratio)22. Because we wanted to determine which
combination of MRI sequence shows the highest performance, the identical process was performed in each sequence (ADC, T2, T1C, and combined ADC, T2, and T1C model). Thus, various
combinations of classification models were trained to differentiate recurrent GBM from RN in the training set. AUC, accuracy, sensitivity, and specificity were obtained in the SMOTE
generated dataset in the training set, with a cutoff value according to Youden’s index. The different feature selection, classification methods, and oversampling were computed using
MatlabR2014b (Mathworks). Statistical significance was set at P < 0.05. DIAGNOSTIC PERFORMANCE IN THE TEST SET Based on the radiomics classification model in the training set, the best
combination of feature selection, classification methods, and oversampling in each sequence was used in the test set. The AUC, accuracy, sensitivity, and specificity were obtained with the
same cutoff from the training set. ABBREVIATIONS * ADC: Apparent diffusion coefficient * APT: Amide proton transfer * CI: Confidence interval * DWI: Diffusion-weighted imaging * DSC: Dynamic
susceptibility contrast * IDH1: Isocitrate dehydrogenase1 * KNN: K-nearest neighbors * KPS: Karnofsky performance status * LASSO: Least absolute shrinkage and selection operator * MGMT:
Oxygen 6-methylguanine-DNA methyltransferase * MI: Mutual information * MRI: Magnetic resonance imaging * MRS: Magnetic resonance spectroscopy * PET: Positron emission tomography * SMOTE:
Synthetic minority over-sampling technique * SVM: Support vector machine * T1C: Postcontrast T1WI * T2: T2WI * GBM: Glioblastoma * RN: Radiation necrosis * RT: Radiation therapy REFERENCES *
Stupp, R. _et al._ Radiotherapy plus concomitant and adjuvant temozolomide for glioblastoma. _N. Engl. J. Med._ 352, 987–996 (2005). Article CAS Google Scholar * Weller, M. _et al._
European Association for Neuro-Oncology (EANO) guideline on the diagnosis and treatment of adult astrocytic and oligodendroglial gliomas. _Lancet Oncol._ 18, e315–e329 (2017). Article
Google Scholar * Lee, J., Ahn, S. S., Chang, J. H. & Suh, C.-O. Hypofractionated re-irradiation after maximal surgical resection for recurrent glioblastoma: Therapeutic adequacy and its
prognosticators of survival. _Yonsei Med. J._ 59, 194–201 (2018). Article Google Scholar * Shah, R. _et al._ Radiation necrosis in the brain: Imaging features and differentiation from
tumor recurrence. _Radiographics_ 32, 1343–1359 (2012). Article Google Scholar * Kumar, A. J. _et al._ Malignant gliomas: MR imaging spectrum of radiation therapy-and chemotherapy-induced
necrosis of the brain after treatment. _Radiology_ 217, 377–384 (2000). Article CAS Google Scholar * Mullins, M. E. _et al._ Radiation necrosis versus glioma recurrence: Conventional MR
imaging clues to diagnosis. _Am. J. Neuroradiol._ 26, 1967–1972 (2005). PubMed Google Scholar * Hein, P. A., Eskey, C. J., Dunn, J. F. & Hug, E. B. Diffusion-weighted imaging in the
follow-up of treated high-grade gliomas: Tumor recurrence versus radiation injury. _Am. J. Neuroradiol._ 25, 201–209 (2004). PubMed Google Scholar * Xu, J.-L. _et al._ Distinction between
postoperative recurrent glioma and radiation injury using MR diffusion tensor imaging. _Neuroradiology_ 52, 1193–1199 (2010). Article Google Scholar * Barajas, R. F. Jr. _et al._
Differentiation of recurrent glioblastoma multiforme from radiation necrosis after external beam radiation therapy with dynamic susceptibility-weighted contrast-enhanced perfusion MR
imaging. _Radiology_ 253, 486–496 (2009). Article Google Scholar * Rabinov, J. D. _et al._ In vivo 3-T MR spectroscopy in the distinction of recurrent glioma versus radiation effects:
Initial experience. _Radiology_ 225, 871–879 (2002). Article CAS Google Scholar * Zhou, J. _et al._ Differentiation between glioma and radiation necrosis using molecular magnetic
resonance imaging of endogenous proteins and peptides. _Nat. Med._ 17, 130 (2011). Article CAS Google Scholar * Kim, Y. H. _et al._ Differentiating radiation necrosis from tumor
recurrence in high-grade gliomas: Assessing the efficacy of 18F-FDG PET, 11C-methionine PET and perfusion MRI. _Clin. Neurol. Neurosurg._ 112, 758–765 (2010). Article Google Scholar *
Park, Y. W. _et al._ Differentiation of recurrent diffuse glioma from treatment-induced change using amide proton transfer imaging: incremental value to diffusion and perfusion parameters.
_Neuroradiology_ https://doi.org/10.1007/s00234-020-02542-5 (2020). * Burger, P. C., Mahaley, M. S. Jr., Dudka, L. & Vogel, F. S. The morphologic effects of radiation administered
therapeutically for intracranial gliomas. A postmortem study of 25 cases. _Cancer_ 44, 1256–1272 (1979). Article CAS Google Scholar * Gillies, R. J., Kinahan, P. E. & Hricak, H.
Radiomics: Images are more than pictures, they are data. _Radiology_ 278, 563–577 (2015). Article Google Scholar * Park, Y. W. _et al._ Whole-tumor histogram and texture analyses of DTI
for evaluation of IDH1-mutation and 1p/19q-codeletion status in world health organization grade II gliomas. _Am. J. Neuroradiol._ 39, 693–698 (2018). Article CAS Google Scholar * Bae, S.
_et al._ Radiomic MRI phenotyping of glioblastoma: Improving survival prediction. _Radiology_ 289, 797–806 (2018). Article Google Scholar * Tian, Q. _et al._ Radiomics strategy for glioma
grading using texture features from multiparametric MRI. _J. Magn. Resonan. Imaging_ 48, 1518–1528 (2018). Article Google Scholar * Park, C. J. _et al._ Diffusion tensor imaging radiomics
in lower-grade glioma: Improving subtyping of isocitrate dehydrogenase mutation status. _Neuroradiology_, 62(3), 319–326 (2020). * Park, Y. W. _et al._ Radiomics MRI phenotyping with machine
learning to predict the grade of lower-grade gliomas: A study focused on nonenhancing tumors. _Korean J. Radiol._ 20, 1381–1389 (2019). Article Google Scholar * Miyashita, M. _et al._
Evaluation of fluoride-labeled boronophenylalanine-PET imaging for the study of radiation effects in patients with glioblastomas. _J. Neurooncol._ 89, 239 (2008). Article Google Scholar *
Chawla, N. V., Bowyer, K. W., Hall, L. O. & Kegelmeyer, W. P. SMOTE: Synthetic minority over-sampling technique. _J. Artif. Intell. Res._ 16, 321–357 (2002). Article Google Scholar *
Dequesada, I. M., Quisling, R. G., Yachnis, A. & Friedman, W. A. Can standard magnetic resonance imaging reliably distinguish recurrent tumor from radiation necrosis after radiosurgery
for brain metastases? A radiographic-pathological study. _Neurosurgery_ 63, 898–904 (2008). Article Google Scholar * Zhang, H., Ma, L., Shu, C., Wang, Y.-B. & Dong, L.-Q. Diagnostic
accuracy of diffusion MRI with quantitative ADC measurements in differentiating glioma recurrence from radiation necrosis. _J. Neurol. Sci._ 351, 65–71 (2015). Article ADS Google Scholar
* Schlemmer, H.-P. _et al._ Differentiation of radiation necrosis from tumor progression using proton magnetic resonance spectroscopy. _Neuroradiology_ 44, 216–222 (2002). Article CAS
Google Scholar * Mehrabian, H., Desmond, K. L., Soliman, H., Sahgal, A. & Stanisz, G. J. Differentiation between radiation necrosis and tumor progression using chemical exchange
saturation transfer. _Clin. Cancer Res._ 23, 3667–3675. https://doi.org/10.1158/1078-0432.Ccr-16-2265 (2017). Article CAS PubMed Google Scholar * Park, J. E. _et al._ Pre- and
posttreatment glioma: Comparison of amide proton transfer imaging with MR spectroscopy for biomarkers of tumor proliferation. _Radiology_ 278, 514–523.
https://doi.org/10.1148/radiol.2015142979 (2016). Article PubMed Google Scholar * Park, J. E. _et al._ Amide proton transfer imaging seems to provide higher diagnostic performance in
post-treatment high-grade gliomas than methionine positron emission tomography. _Eur. Radiol._ 28, 3285–3295. https://doi.org/10.1007/s00330-018-5341-2 (2018). Article PubMed Google
Scholar * Zhang, H. _et al._ Role of magnetic resonance spectroscopy for the differentiation of recurrent glioma from radiation necrosis: a systematic review and meta-analysis. _Eur J
Radiol_ 83, 2181–2189. https://doi.org/10.1016/j.ejrad.2014.09.018 (2014). Article PubMed Google Scholar * Hu, L. S. _et al._ Relative cerebral blood volume values to differentiate
high-grade glioma recurrence from posttreatment radiation effect: Direct correlation between image-guided tissue histopathology and localized dynamic susceptibility-weighted
contrast-enhanced perfusion MR imaging measurements. _AJNR Am. J. Neuroradiol._ 30, 552–558. https://doi.org/10.3174/ajnr.A1377 (2009). Article CAS PubMed PubMed Central Google Scholar
* Cha, J. _et al._ Analysis of the layering pattern of the apparent diffusion coefficient (ADC) for differentiation of radiation necrosis from tumour progression. _Eur. Radiol._ 23, 879–886
(2013). Article Google Scholar * Hu, L. S. _et al._ Reevaluating the imaging definition of tumor progression: Perfusion MRI quantifies recurrent glioblastoma tumor fraction,
pseudoprogression, and radiation necrosis to predict survival. _Neuro-oncology_ 14, 919–930 (2012). Article Google Scholar * Park, Y. W. _et al._ Radiomics and machine learning may
accurately predict the grade and histological subtype in meningiomas using conventional and diffusion tensor imaging. _Eur. Radiol._ 29, 4068–4076 (2019). Article Google Scholar * Park, Y.
W. _et al._ Radiomics model predicts granulation pattern in growth hormone-secreting pituitary adenomas. _Pituitary_ 23(6), 691–700 (2020). * Peng, L. _et al._ Distinguishing true
progression from radionecrosis after stereotactic radiation therapy for brain metastases with machine learning and radiomics. _Int. J. Radiat. Oncol. Biol. Phys._ 102, 1236–1243 (2018).
Article Google Scholar * Zhang, Z. _et al._ A predictive model for distinguishing radiation necrosis from tumour progression after gamma knife radiosurgery based on radiomic features from
MR images. _Eur. Radiol._ 28, 2255–2263 (2018). Article Google Scholar * Tiwari, P. _et al._ Computer-extracted texture features to distinguish cerebral radionecrosis from recurrent brain
tumors on multiparametric MRI: A feasibility study. _Am. J. Neuroradiol._ 37, 2231–2236 (2016). Article CAS Google Scholar * Zhang, Q. _et al._ Differentiation of recurrence from
radiation necrosis in gliomas based on the radiomics of combinational features and multimodality MRI images. _Comput. Math. Methods Med._ 2019, 2893043. https://doi.org/10.1155/2019/2893043
(2019). Article PubMed PubMed Central MATH Google Scholar * Wang, K. _et al._ Individualized discrimination of tumor recurrence from radiation necrosis in glioma patients using an
integrated radiomics-based model. _Eur. J. Nucl. Med. Mol. Imaging_ 47, 1400–1411. https://doi.org/10.1007/s00259-019-04604-0 (2020). Article CAS PubMed Google Scholar * Ellingson, B. M.
_et al._ Consensus recommendations for a standardized Brain Tumor Imaging Protocol in clinical trials. _Neuro Oncol._ 17, 1188–1198. https://doi.org/10.1093/neuonc/nov095 (2015). Article
PubMed PubMed Central Google Scholar * Kaufmann, T. J. _et al._ Consensus recommendations for a standardized brain tumor imaging protocol for clinical trials in brain metastases. _Neuro
Oncol._ 22, 757–772. https://doi.org/10.1093/neuonc/noaa030 (2020). Article PubMed Google Scholar * Punyakanok, V., Roth, D., Yih, W.-T. & Zimak, D. Learning and inference over
constrained output. _IJCAI_ 5, 1124–1129 (2005). Google Scholar * Sinha, S., Bastin, M. E., Whittle, I. R. & Wardlaw, J. M. Diffusion tensor MR imaging of high-grade cerebral gliomas.
_Am. J. Neuroradiol._ 23, 520–527 (2002). PubMed Google Scholar * Park, Y. W. _et al._ Diffusion tensor and postcontrast T1-weighted imaging radiomics to differentiate the epidermal growth
factor receptor mutation status of brain metastases from non-small cell lung cancer. _Neuroradiology_ https://doi.org/10.1007/s00234-020-02529-2 (2020). * Omuro, A. & DeAngelis, L. M.
Glioblastoma and other malignant gliomas: A clinical review. _JAMA_ 310, 1842–1850 (2013). Article CAS Google Scholar * Louis, D. N. _et al._ The 2016 World Health Organization
classification of tumors of the central nervous system: A summary. _Acta Neuropathol._ 131, 803–820 (2016). Article Google Scholar * Hopewell, J. _et al._ In _Acute and Long-Term
Side-Effects of Radiotherapy_ 1–16 (Springer, New York, 1993). * Panth, K. M. _et al._ Is there a causal relationship between genetic changes and radiomics-based image features? An in vivo
preclinical experiment with doxycycline inducible GADD34 tumor cells. _Radiother. Oncol._ 116, 462–466. https://doi.org/10.1016/j.radonc.2015.06.013 (2015). Article CAS PubMed Google
Scholar * Zinn, P. O. _et al._ A coclinical radiogenomic validation study: Conserved magnetic resonance radiomic appearance of periostin-expressing glioblastoma in patients and xenograft
models. _Clin. Cancer Res._ 24, 6288–6299. https://doi.org/10.1158/1078-0432.Ccr-17-3420 (2018). Article CAS PubMed PubMed Central Google Scholar * Nael, K. _et al._ Multiparametric MRI
for differentiation of radiation necrosis from recurrent tumor in patients with treated glioblastoma. _AJR Am. J. Roentgenol._ 210, 18–23. https://doi.org/10.2214/ajr.17.18003 (2018).
Article PubMed Google Scholar * Blonigen, B. J. _et al._ Irradiated volume as a predictor of brain radionecrosis after linear accelerator stereotactic radiosurgery. _Int. J. Radiat.
Oncol. Biol. Phys._ 77, 996–1001. https://doi.org/10.1016/j.ijrobp.2009.06.006 (2010). Article PubMed Google Scholar * Ruben, J. D. _et al._ Cerebral radiation necrosis: Incidence,
outcomes, and risk factors with emphasis on radiation parameters and chemotherapy. _Int. J. Radiat. Oncol. Biol. Phys._ 65, 499–508. https://doi.org/10.1016/j.ijrobp.2005.12.002 (2006).
Article ADS PubMed Google Scholar * Takano, S. _et al._ Detection of IDH1 mutation in human gliomas: Comparison of immunohistochemistry and sequencing. _Brain Tumor Pathol._ 28, 115–123
(2011). Article CAS Google Scholar * Brandes, A. A. _et al._ MGMT promoter methylation status can predict the incidence and outcome of pseudoprogression after concomitant
radiochemotherapy in newly diagnosed glioblastoma patients. _J. Clin. Oncol._ 26, 2192–2197 (2008). Article Google Scholar * Chenevert, T. L. _et al._ Errors in quantitative image analysis
due to platform-dependent image scaling. _Transl. Oncol._ 7, 65–71. https://doi.org/10.1593/tlo.13811 (2014). Article PubMed PubMed Central Google Scholar * Avants, B. B., Tustison, N.
& Song, G. Advanced normalization tools (ANTS). _Insight J._ 2, 1–35 (2009). Google Scholar * Shinohara, R. T. _et al._ Statistical normalization techniques for magnetic resonance
imaging. _NeuroImage Clin._ 6, 9–19 (2014). Article Google Scholar * van Griethuysen, J. J. M. _et al._ Computational radiomics system to decode the radiographic phenotype. _Cancer Res._
77, e104–e107. https://doi.org/10.1158/0008-5472.Can-17-0339 (2017). Article PubMed PubMed Central Google Scholar * Zwanenburg, A., Leger, S., Vallières, M. & Löck, S. Image
biomarker standardisation initiative. _arXiv preprint _arXiiv:1612.07003 (2016). * Bahrami, N. _et al._ Edge contrast of the FLAIR hyperintense region predicts survival in patients with
high-grade gliomas following treatment with bevacizumab. _Am. J. Neuroradiol._ 39, 1017–1024 (2018). Article CAS Google Scholar * DeLong, E. R., DeLong, D. M. & Clarke-Pearson, D. L.
Comparing the areas under two or more correlated receiver operating characteristic curves: A nonparametric approach. _Biometrics_ 44, 837–845 (1988). Article CAS Google Scholar *
Tibshirani, R. Regression shrinkage and selection via the lasso. _J. R. Stat. Soci. Ser. B (Methodol.)_ 58, 267–288 (1996). MathSciNet MATH Google Scholar Download references
ACKNOWLEDGEMENTS This research received funding from the Basic Science Research Program through the National Research Foundation of Korea (NRF) funded by the Ministry of Science, Information
and Communication Technologies & Future Planning (2017R1D1A1B03030440 and 2020R1A2C1003886). This research was also supported by Basic Science Research Program through the National
Research Foundation of Korea (NRF) funded by the Ministry of Education (2020R1I1A1A01071648). This research was also supported financially by the fund of Korean Society for Neuro Oncology.
AUTHOR INFORMATION AUTHORS AND AFFILIATIONS * Department of Radiology and Research Institute of Radiological Science and Center for Clinical Image Data Science, Yonsei University College of
Medicine, 50-1 Yonsei-ro, Seodaemun-gu, Seoul, 120-752, South Korea Yae Won Park, Sung Soo Ahn, Hwiyoung Kim & Seung-Koo Lee * Department of Computer Science, Yonsei University, Seoul,
South Korea Dongmin Choi * Department of Radiology and Research Institute of Radiology, University of Ulsan College of Medicine, Seoul, South Korea Ji Eun Park & Ho Sung Kim * Department
of Neurosurgery, Yonsei University College of Medicine, Seoul, South Korea Jong Hee Chang * Department of Pathology, Yonsei University College of Medicine, Seoul, South Korea Se Hoon Kim
Authors * Yae Won Park View author publications You can also search for this author inPubMed Google Scholar * Dongmin Choi View author publications You can also search for this author
inPubMed Google Scholar * Ji Eun Park View author publications You can also search for this author inPubMed Google Scholar * Sung Soo Ahn View author publications You can also search for
this author inPubMed Google Scholar * Hwiyoung Kim View author publications You can also search for this author inPubMed Google Scholar * Jong Hee Chang View author publications You can also
search for this author inPubMed Google Scholar * Se Hoon Kim View author publications You can also search for this author inPubMed Google Scholar * Ho Sung Kim View author publications You
can also search for this author inPubMed Google Scholar * Seung-Koo Lee View author publications You can also search for this author inPubMed Google Scholar CONTRIBUTIONS S.S.A. designed the
study. J.H.C. and S.H.K. compiled the institutional database. J.E.P. and H.S.K. provided external validation dataset. D.C, H.K., and S.-K.L designed the radiomics pipeline and D.C.
performed the radiomics analyses. Y.W.P. wrote the first draft of the manuscript, and S.S.A. provided the critical revision of the manuscript. S.-K.L. supervised the manuscript. All authors
contributed to and approved the final manuscript. CORRESPONDING AUTHOR Correspondence to Sung Soo Ahn. ETHICS DECLARATIONS COMPETING INTERESTS The authors declare no competing interests.
ADDITIONAL INFORMATION PUBLISHER'S NOTE Springer Nature remains neutral with regard to jurisdictional claims in published maps and institutional affiliations. SUPPLEMENTARY INFORMATION
SUPPLEMENTARY INFORMATION. RIGHTS AND PERMISSIONS OPEN ACCESS This article is licensed under a Creative Commons Attribution 4.0 International License, which permits use, sharing, adaptation,
distribution and reproduction in any medium or format, as long as you give appropriate credit to the original author(s) and the source, provide a link to the Creative Commons licence, and
indicate if changes were made. The images or other third party material in this article are included in the article's Creative Commons licence, unless indicated otherwise in a credit
line to the material. If material is not included in the article's Creative Commons licence and your intended use is not permitted by statutory regulation or exceeds the permitted use,
you will need to obtain permission directly from the copyright holder. To view a copy of this licence, visit http://creativecommons.org/licenses/by/4.0/. Reprints and permissions ABOUT THIS
ARTICLE CITE THIS ARTICLE Park, Y.W., Choi, D., Park, J.E. _et al._ Differentiation of recurrent glioblastoma from radiation necrosis using diffusion radiomics with machine learning model
development and external validation. _Sci Rep_ 11, 2913 (2021). https://doi.org/10.1038/s41598-021-82467-y Download citation * Received: 30 June 2020 * Accepted: 05 January 2021 * Published:
03 February 2021 * DOI: https://doi.org/10.1038/s41598-021-82467-y SHARE THIS ARTICLE Anyone you share the following link with will be able to read this content: Get shareable link Sorry, a
shareable link is not currently available for this article. Copy to clipboard Provided by the Springer Nature SharedIt content-sharing initiative