Measuring cancer hallmark mediation of the tet1 glioma survival effect with linked neural-network based mediation experiments
- Select a language for the TTS:
- UK English Female
- UK English Male
- US English Female
- US English Male
- Australian Female
- Australian Male
- Language selected: (auto detect) - EN
Play all audios:
ABSTRACT This paper examines the effect of TET1 expression on survival in glioma patients using open-access data from the Genomic Data Commons. A neural network-based survival model was
built on expression data from a selection of genes most affected by TET1 knockdown with a median cross-validated survival concordance of 82.5%. A synthetic experiment was then conducted that
linked two separately trained neural networks: a multitask model estimating cancer hallmark gene expression from TET1 expression, and a survival neural network. This experiment quantified
the mediation of the TET1 survival effect through eight cancer hallmarks: apoptosis, cell cycle, cell death, cell motility, DNA repair, immune response, two phosphorylation pathways, and a
randomized gene sets. Immune response, DNA repair, and apoptosis displayed greater mediation than the randomized gene set. Cell motility was inversely associated with only 12.5% mediated
concordance. We propose the neural network linkage mediation experiment as an approach to collecting evidence of hazard mediation relationships with prognostic capacity useful for designing
interventions. SIMILAR CONTENT BEING VIEWED BY OTHERS GENE REGULATORY NETWORKS ANALYSIS FOR THE DISCOVERY OF PROGNOSTIC GENES IN GLIOMAS Article Open access 23 April 2025 SURVIVAL PREDICTION
OF GLIOBLASTOMA PATIENTS USING MODERN DEEP LEARNING AND MACHINE LEARNING TECHNIQUES Article Open access 29 January 2024 LEVERAGING TME FEATURES AND MULTI-OMICS DATA WITH AN ADVANCED DEEP
LEARNING FRAMEWORK FOR IMPROVED CANCER SURVIVAL PREDICTION Article Open access 24 April 2025 INTRODUCTION Gliomas represent approximately 75% of primary brain tumors in adults. The median
survival of adult patients with gliomas is less than five years, with overall survival of 8–14 months for patients with glioblastoma multiforme (GBM)1. The current standard of care includes
surgery followed by radiation therapy and treatment with temozolomide. The therapy causes cells to die as a result of extensive DNA damage. Factors that contribute to recurrence are glioma
invasiveness, the growth of cell populations resistant to radiation and temozolomide, and the blood brain barrier2,3. Classifications of gliomas have been adding molecular features to
histology for better diagnosis, especially under circumstances when histological phenotype is unclear. For example, the revised World Health Organization classifications now include 1p/19q
co-deletion as a defining feature of oligodendroglial tumors4. The use of molecular features will result in more precise prognosis and in the design of treatments tailored to the tumor.
Resistance to the alkylating agent temozolomide is associated with promoter methylation of the gene encoding the DNA repair protein O6-methylguanine-DNA methyltransferase5. We recently
reported that glioma cell lines deficient with Tet methylcytosine dioxygenase 1 (TET1) exhibited greater genomic instability and were more resistant to ionizing radiation therapy6. TET1
belongs to a family of enzymes comprised of three members that catalyzes the conversion of 5-methylcytosine (5-mC) to 5-hydroxymethylcytosine (5-hmC), which is the initial step of DNA
demethylation7. We found that TET1-deficient cells displayed an attenuated DNA damage response (DDR). TET1-deficient cells fail to undergo apoptosis in response to ionizing radiation and
have attenuated DNA repair resulting in high numbers of DNA strand breaks in the survival cell population6,8. There has also been evidence indicating the involvement of TET1 in glioma growth
in humans. The levels of 5-hydroxymethyl cytosine were strongly depleted in astrocytomas compared to a normal brain9. In a study examining the Cancer Genome Atlas, the levels of 5hmC were
reported to be associated with poor survival in anaplastic glioma10 and GBM11. The hypothesis tested here is that genes involved in the DDR mediate the poor prognosis of glioma patients with
low levels of TET1. To test the hypothesis, we modeled mediation relationships between TET1, glioma survival, and eight cancer hallmarks using a linked neural network experiment and data
from the Genomic Data Commons. Neural networks demonstrate strong predictive capacity in diverse tasks, such as image classification, speech recognition, and survival models12,13,14. These
models are typically trained using observational data and, as a result, sometimes cannot discern correlative relationships from causal ones15. The mediation experiment described here is
meant to enhance survival neural networks by generating causal hypotheses. To test mediation results, mutation data was analyzed in the Genomic Data Commons (GDC) and cell motility was
evaluated in a wound-healing assay. We report that genes involved in the DDR and cell motility mediate the TET1 effect on survival. Additionally, we found a strong association between the
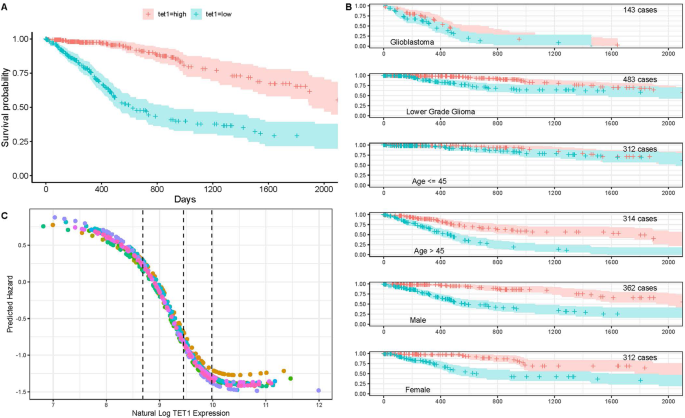
effect of TET1 on survival and immune response genes. RESULTS TET1 SATURATION IN A SINGLE VARIABLE SURVIVAL NEURAL NETWORK The first series of experiments were constructed to determine the
relation between survival and TET1 expression. Survival probability curves were developed for patients with high/low TET1 expression (tethigh/tetlow) relative to the median expression. TET1
was analyzed directly with GDC RNA-Seq expression data. The 50% survival for tetlow is about 650 days, while 50% survival probability for tethigh is greater than 2,000 days (Fig. 1A). The
relationship between TET1 and patient survival was observed in both GBM and low-grade gliomas (Fig. 1B), and both male and female patients saw similar survival curves. Interestingly, the
relationship was much weaker in patients younger than 45 years of age. A single input variable survival neural network, the TET1 only model, was built from TET1 expression alone to
illustrate how neural networks can estimate hazard. The SurvivalNet package was used to build this model with two 10 unit hidden layers and a Cox proportional hazards output layer16. The
network transforms TET1 expression values into patient hazard. Higher hazard means shorter predicted survival time. Figure 1C shows the hazard functions that are learned by training TET1
only models on 10 non-intersecting partitions of the patient data. In all 10 models, a reduction in hazard is estimated as TET1 expression approached the median value (middle black line).
Hazard is highest in the first quartile of expression (left of first dotted line) and lowest (right of last dotted line) in the 4th quartile of expression. No post-processing was performed
on the neural network hazard curves in Fig. 1C. The resulting curves show strong consistency despite training on randomized non-overlapping patient partitions. In cross-validation, the TET1
only model achieved 72.5% average concordance. Each of the training iterations shows a flattening of the hazard curve above a natural log TET1 expression of 10. Flattening hazard above a
sufficient level of expression may indicate a saturation effect where TET1 expression gives no additional benefit above a saturation value. CONFOUNDERS AFFECTING THE TET1 EFFECT ON SURVIVAL
We investigated some patient and tumor characteristics that might modify the effect that TET1 has on glioma patients. TET1 expression is greater in younger (<45 years) than older patients
(Supplemental Fig. 1A) TET1 is differentially expressed with histological type and has greater expression in low-grade tumors than in GBM (Supplemental Fig. 1B). The expression of TET1 is
greater in tumors that harbor isocitrate dehydrogenase (IDH) mutations (Supplemental Fig. 1C) in both GBM and low-grade gliomas (Supplemental Fig. 1D). These correlations indicate that the
observed TET1 hazard is confounded by age, histology, and IDH1 status. A multivariate Cox proportional hazards model was constructed on TET1 quartile expression (Q3/4, Q2, and Q1 refer to
quartiles, with Q1 the lowest) to evaluate whether TET1 hazard remains significant after controlling for age, IDH1 mutation status, and histology. The lowest quartile of TET1 expression is
significantly associated with glioma hazard in a multivariate model of TET1 + age + IDH1 status + Histological type. The reduction in TET1 significance in the multivariate model
(Supplemental Fig. 2B) relative to the univariate model (Supplemental Fig. 2A) indicates partial confounding of the TET1 survival effect and these factors. Forest plots were conducted
(Supplemental Fig. 3) to track the significance and confidence intervals of TET1 hazard intervals from the six Kaplan-Meier curve plots in Fig. 1. Expression quartiles are derived from the
full patient set and not for each set of patients. The TET1 hazard ratio is significant at the 0.001 level for Q1 in all patient categories (lower-grade gliomas, patients under/over 45,
male/female patients) except in GBM patients, where a trend was observed. To further investigate the effect of confounders, patient-set-specific forest plots were computed using multivariate
Cox proportional hazards models. In patients with lower-grade gliomas (LGG) and patients over 45, the TET1 hazard ratio remains significant. In all other patient sets, the TET1 hazard ratio
remains positive for Q1, the lowest quartile of expression (Supplemental Fig. 4). These results are weakened by the relatively small patient counts in each category. TET1 DIFFERENTIALLY
EXPRESSED GENES PRESERVE THE TET1 SURVIVAL EFFECT To strengthen the TET1 only model, we looked for genes causally related to TET1. The use of many related genes in the same model allows for
creation of more complex functions of survival. Genes were selected from an earlier study6,8 in which gene expression was compared between a human glioma cell line that was made
TET1-deficient and a control cell line (Supplemental Table 1). We selected 20 genes with the largest differential expression. These genes were further filtered to 11 by removing those genes
with incomplete RNA-seq expression data in the GDC expression files (Table 1). Notably, the selection did not rely on any prior knowledge of prognostic relevance. A TET1 affected genes model
was built with SurvivalNet to evaluate the association between the affected gene expression and survival. TET1 and each of the 11 TET1 affected genes were used. While the purpose of this
work is to generate mediation associations of the TET1 affected genes model, it is informative to test the concordance of this model and compare it to the more traditional Cox proportional
hazards model. The median concordance increases from ~72.5% for the TET1 only model to 82.5% in the TET1 affected genes model. A Cox proportional hazards model evaluated on the same 10 train
and test folds achieves 79.6% mean concordance and is not significantly worse. The TET1-only survival effect is preserved in the model built from affected genes. When the TET1 only model
correctly ranked a pair of patients, the TET1 affected genes model also correctly ranked those patients 90% of the time. When the TET1 model incorrectly ranked a pair of patients, the
affected genes model also incorrectly ranked those patients 45% of the time. The shared accuracy indicates that the majority of the observed TET1 survival effect is captured in the TET1
affected genes model. The shared inaccuracy indicates that the TET1 affected genes model is somewhat specific to the TET1 survival effect. CANCER HALLMARKS MODEL SURVIVAL The next series of
experiments investigated whether the TET1 effect on survival was mediated by sets of genes termed cancer hallmarks. The term “hallmark” was coined to indicate gene families involved in tumor
growth, metastasis, and immune response evasion17. Hallmark gene sets were selected from a prior publication focusing on identification of prognostic hallmark-based gene signatures18. Eight
hallmarks (shown in Fig. 2A) were used to model survival: (1) apoptosis, (2) cell cycle, (3) cell death, (4) cell motility, (5) DNA repair, (6) immune response, (7) phosphorylation pathway
1, and (8) phosphorylation pathway 2. Each hallmark gene set was reduced to 20–30 genes by removing those without complete expression data in some GDC patients. Univariate Cox proportional
hazards models were built for every gene in each hallmark for gliomas. Figure 2A gives the concordance of each single gene model. These metrics help indicate which genes have the greatest
contribution to the concordances of survival networks that were built for each hallmark. The concordances for each gene in each hallmark were within the range of 0.5 to 0.75. Survival
networks built for each hallmark had greater cross-validated median concordances than any univariate gene concordance. A ninth “permutation” pathway was added consisting of random selections
of 10 genes to test whether the concordance was due to chance. Every hallmark model had cross-validated median concordance greater than (1) the median concordance of 50 models built from
random gene sets (“permutations” hallmark), and (2) a concordance derived from a univariate Cox proportional hazards model of International Classification of Diseases for Oncology ICD_O_3
histological type (0.7) (Fig. 2B). The DNA repair and immune response models achieved the highest median concordances Models were compared to the permutation experiments via repeated
one-sided Wilcoxon signed ranked tests (Fig. 2C). This statistical test was shown to be the preferred statistical measure for comparing cross-validated model evaluations19. The immune
response and DNA repair hallmarks performed better in cross-validation at the p = 0.05 level against every repetition of the permutation test, strongly indicating that these gene sets are
better than random selections for modeling survival. Every other hallmark except cell motility performed almost as well or better than the false discovery rate against all 50 random gene set
experiments. The association between each hallmark model and the TET1 affected model were evaluated in a mediation experiment. Here, mediation refers to the degree by which the effect of
TET1 on survival may be carried out through an intermediary signal, such as the expression of hallmark genes. This neural network-based mediation model is framed on similar experiments done
with linear models and described in more detail in the methods. The mediated effect measurement examines whether the TET1 effect on survival is mediated by one or more of the cancer
hallmarks. The mediation experiments ask the question: “What is the patient hazard associated with the given hallmark if the hallmark genes take on expression values predicted by TET1?” For
high concordance to be maintained in the mediation experiment, the TET1 multitask gene expression models must predict hallmark gene expression values that work well with the pre-trained
hallmark survival models. Additionally, the pre-trained hallmark survival models must align well with the TET1 direct model. Mediation is determined by inputting predicted expression values
from multitask models into the pre-trained hallmark survival networks. The concordance of this composed model is then computed on the set of patient pairs ranked correctly by the TET1 and
affected genes’ survival net. This concordance is reported as the percent mediated effect. For a given hallmark, the simulated mediation experiment takes place in two parts: measurement of a
hallmark-mediated survival effect, and comparison to the direct survival effect attributable to TET1 and affected genes. In the direct effect, TET1 and its affected genes are collected as
an input vector into a survival network that predicts hazard. This is the bottom path in Fig. 3A, and it is the same experiment performed in the section on TET1 survival effect mediation by
TET1 affected genes. The top path in Fig. 3A (mediated effect) is made up of two steps. First, a multitask neural network is constructed to predict hallmark gene expression from TET1
affected genes. The multitask neural network is made up of an input layer with TET1 and its affected genes, two fully connected ReLU feed forward hidden layers, and an output for each
hallmark gene. Independently, survival networks are constructed for each hallmark and trained directly on hallmark gene expression values. These are the same hallmark survival networks that
were described previously. The models for both the directed and mediated effects generate numeric hazard values for each patient. A metric of mediation, the percent mediated effect mentioned
previously, is derived from the percentage of pairs of patients correctly ranked by the direct model that are also correctly ranked by the mediated model. A percent mediated effect near 1
indicates that the survival effect attributed to the TET1 model is maintained by the given hallmark model, even after transforming the hallmark models inputs via TET1 predicted expression.
For a given hallmark, this means that if the input genes take values predicted by TET1 expression, then the existing hallmark model will correctly rank patients who are also correctly ranked
by TET1 models – demonstrating that the TET1 survival effect is preserved and that the hallmark is a potential mediator. If the percent mediated effect is near zero, then patients correctly
predicted by the TET1 model are incorrectly predicted in the mediation experiment more often than would be expected by chance. This indicates that the associated hallmark may be an inverse
mediator, i.e., the survival effect associated with TET1 is reversed if hallmark genes take on values conditioned on TET1 expression. Figure 3B displays the percent mediated effect derived
in cross-validation for each endpoint. A random hazard function was used as a control and denoted by “randomized”. In the random control, each patient is given a random hazard value sampled
from the standard normal distribution. This is done 50 times across 10 folds of cross-validation, so 500 points are visualized in the figure. The DNA repair and immune hallmarks showed
percent mediated effects significantly greater than the randomized hazard hallmark. The cell motility hallmark showed a percent mediated effect significantly less than the randomized hazard
hallmark. The variance in the DNA repair gene set was large and might be due to the selection of genes examined. The genes in this set cover several different pathways that work
independently and in response to different types of damage (see discussion). Two-sided Wilcoxon tests generated 50 p-values from comparison of hallmarks to each random hazard function. The
median Wilcoxon p-value (column 2 in Fig. 3C) was calculated for each hallmark. This was then repeated for 10,000 random hazard functions against each of the 50 random hazard functions shown
in Fig. 3C to generate a simulated distribution of random hazard function median p-values. The “simulated P” column in Fig. 3C shows the result of this comparison, where cell cycle, cell
motility, and immune response outperform all 10,000 random hazard functions. DNA repair outperforms almost all random hazard functions with a median p-value of 0.03. DNA REPAIR MEDIATES THE
TET1 EFFECT ON SURVIVAL Poorer survival is often associated with tumors with more deletions, mutations, and copy number variations20. Indeed, we found that glioma patients with a low
mutation count (derived from GDC MAF files) had the highest survival probability, followed by moderate and then high mutation counts (Fig. 4A). At 1,000 days as evaluated from day 0 tumor
biopsy, the survival probabilities for patients with low, moderate, and high mutation count were approximately 0.8, 0.4, and 0.2, respectively. If DNA repair mediates the effect of TET1 on
survival, we would expect to observe a higher number of mutations in tumors expressing low levels of TET1. The number of mutations drops significantly as TET1 expression increases (Fig. 4B).
A driver of mutation count could be inactivation of DNA repair genes. PREDICTED GENE EXPRESSION AND DIRECT EFFECT MODEL HAZARD We evaluated the contribution of specific genes to the
observed percent mediation (Fig. 4C). In DNA repair, negative Pearson correlations were detected in NEIL (nucleotide excision repair)21 and in RAD17 (DNA-damage induced cell cycle
checkpoint)22. Positive Pearson coefficients were found in several genes, including XAB2 metaphase delay23, UVRAG (pro autophagy and NOTCH positive regulator)24, and SFPQ, a multifunctional
pro DNA repair gene25, which is also involved in the regulation of L1 retrotransposons and proliferation26. Two other genes in the DNA repair hallmark having positive Pearson coefficients
include RAD23B (nucleotide excision repair)27, and ATXN3 (represses the tumor suppressor PTEN), which is associated with tumor proliferation in gastric, lung, and testicular cancers28,29.
The immune response to tumors involves different pathways that stimulate as well as suppress tumor rejection. A strong negative Pearson correlation was determined between IL9/NFKB expression
and the direct effect model hazard values (Fig. 4C). IL9 is a cytokine released from the CD4 subset of Th9 cells that is involved in the anti-tumor response30. Several positive correlations
were observed, including genes in the innate response that included oncostatin M (OSM), a member of the IL-6 family31, and the tumor necrosis factor family member TNFSF13 (also referred to
as APRIL). Increases in expression of inflammatory genes often promote cancers32. VTCN1 is a B7 co-stimulatory family member that blocks antigen presentation33. Aggressive gliomas are more
difficult to treat because cells are mobile and infiltrate/invade surrounding tissue34,35. The inverse association between TET1 hazard and cell motility was surprising. Positive coefficients
were determined between the HMG-CoA reductase, which is the rate-limiting enzyme for cholesterol synthesis, sonic hedgehog (SHH), peroxisomal Biogenesis Factor 5, and the sodium channel
epithelium1 beta. Negative associations were determined between the SHH transducer smoothened/frizzled class receptor (Smo), Tyrosine 3- Monooxygenase/Tryptophan 5-Monooxygenase (YWHAE), the
RHO family GTPase Vav3, the scavenger receptor CD36 (SCARB1), and Coro1A, which belongs to a family of evolutionary conserved actin binding proteins. Interestingly, the Pearson correlation
for two genes in the SHH pathway, SHH and Smo, are in opposite directions. TET1-DEFICIENT CELLS DISPLAY POOR CELL MOTILITY Other studies examining the GDC database reported better migration
correlated with poorer survival in patients with gliomas35. To assess the causal effects of TET1 deficiency on cell motility, migration was compared between a TET1-deficient and control A172
glioma cell line using the wound-healing assay. TET1-deficient and control cells lines were established as previously described6,8. At four hours after initializing migration with the
scratch, the control cells migrated considerably into the cell-free area and at 12 hours the control cells were found throughout the area. In contrast, the TET1-deficient A172 glioma cell
line did not display significant migration at four hours after initializing migration, and at 12 hours migration was observed but significantly differently compared to the control cell line
(Fig. 4D and Supplement Table 2). Similar findings were made when the experiment was repeated with the U87 cell line (data not shown). DISCUSSION This study was conducted to test the
hypothesis that genes involved in the DDR mediate the poor prognosis of glioma patients with low levels of TET1. The hypothesis was based on our experimental findings that knocking down TET1
expression increased DNA strand breaks, attenuated cell cycle checkpoint, and increased resistance to ionizing radiation in glioma cell lines6,8. We confirmed studies by others of the
relationship between poorer survival and low levels of TET1 expression in glioma patients. We further found that the relationship was strongest between TET1 expression and survival in
low-grade gliomas. To examine the involvement of the DDR using observational data, we took a novel approach linking neural networks to build mediation evidence. This approach helps us better
understand causal relationships. The DDR protects the integrity of the genome. We presented evidence that the integrity of the genome is compromised when TET1 levels are low. Higher numbers
of mutations were found in gliomas with low levels of TET1 expression. Genomic instability increases heterogeneity in the tumor cell population, which has been shown to increase the
resistance of tumors to therapy36,37. The mechanism for the genomic instability appears to be genes involved in the DDR. A positive Pearson correlation coefficient was determined with
RAD23B, but a negative coefficient was observed with NEIL1. Both genes are involved in nucleotide exchange repair. RAD23B recognizes the damage that is excised by NEIL repair21. In the
absence of NEIL activity, nuclear exchange repair would not be completed even though there is recognition of the damage. The DDR prevents the proliferation of cells that harbor an unstable
genome. In a previous study, we found that cycle checkpoints attenuated in TET1-deficient gliomas. In this study, our analysis indicates that genes needed to prevent cell cycle progression
are repressed. The decrease in RAD17 removes a G1/S checkpoint22. The increases in expression of ATXN3 would be expected to repress the tumor suppressor PTEN, which negates several pathways
involved in tumor growth. Indeed, ATXN3 expression is associated with tumor proliferation in gastric, lung, and testicular cancers28,29. We also presented evidence suggesting the involvement
of the immune response for mediating poor survival among patients with low levels of TET1 expression. Finding the involvement of the immune response is an advantage of our approach because
human immune responses are difficult to model experimentally. Interestingly, differences were observed in the involvement of the innate and acquired immune responses. Two cytokine genes
involved in innate immune response, TNFSF13 and OSM, were positively correlated with the direct TET1 associated hazard. This indicates an active innate response. VTCN1 (B7-H4) expression was
also positively correlated with the direct TET1 associated hazard. B7-H4 is a member of the co-stimulatory and co-inhibitory B7 family and inhibits T-cell activation and clonal expansion of
CD4 and CD8 cells in several different types of tumors, including gliomas38. Increases in B7-H4 would attenuate the presentation of glioma antigens and result in a poor immune response. The
prognostic value of elevated levels of B7-H4 expression has been reported in gastric39,40, pancreatic40, and non-small-cell lung cancers41,42. Expression positively associates with
progression in prostate cancer43. One consequence of poor antigen presentation would be the absence of the involvement of Th9 cells, which is a subset of CD4 cells that is involved in
anti-cancer immunity44. IL-9 expression was negatively correlated with the direct TET1 associated hazard. IL-9 is the cytokine released from Th9 cells. Several experimental models have shown
the involvement of Th9 cells in the immune response against tumors. IL-9 was shown to increase expression of p21 and TRAIL in melanoma and also enhances the anti-tumor activity of mast
cells45. Overall, it appears that the TET1 associated hazard is due to a heightened innate immune response that fails to convert to an effective acquired immune response. The cell migration
pathway was negatively associated with the direct TET1 associated hazard. Examining the contribution of specific genes, positive Pearson correlations were determined with two genes that have
been reported to promote migration in gliomas, HMG-CoA reductase46 and sonic hedgehog47, but negative associations were determined with smoothened/frizzled class receptor (Smo)48 and Vav3.
Smo48 and Vav349 are transducers and are required to activate intracellular pathways for migration in gliomas. It appears that migration is being induced through extracellular stimulation
but that the direct TET1 associated hazard is associated with the expression of genes involved in the intracellular signal pathways required for migration. While far from a complete
framework, the neural network linkage mediation experiment described in this paper is a novel approach to collecting evidence for mediation relationships. The model provides prognostic
capacity as well as mediation explanations that can be used to design interventions. Indeed, immune response involvement is difficult to model in humans and thus requires mouse models.
Considering the successes in immune modulation for treating cancers, TET1 is a potential marker for predicting whether the gliomas would be responsive to biological agents that target Il-9
and VTCN1. MATERIALS/METHODS DATA USED FOR ANALYSIS Three datasets were used: The genomic data commons for glioma patient data; an _in-vitro_ TET1 knockdown experiment provided in the
Supplemental Table 1; and cancer hallmark gene sets previously reported18. All patient and molecular data was aggregated from the Genomic Data Commons (GDC). We built and used an open-source
Scala client, GDC-Scala, for the GDC API to collect all data sets. Tutorials for using GDC-Scala are available at the repository address. Data for 703 patients with glioblastoma (GBM) and
all other lower-grade gliomas (LGG) was collected. Three kinds of patient data were collected. * 1. CLINICAL DATA: Patient days-to-death and days-to-last-follow-up were collected from GDC
clinical xml files. These files additionally provide histological data. See GDC documents on clinical data harmonization:
gdc.cancer.gov/about-data/data-harmonization-and-generation/clinical-data-harmonization * 2. EXPRESSION DATA: RNA-seq data was collected for each patient. Data was log normalized and
expression was scaled to standard normal. We used the UQ-FPKM gene expression quantification. See GDC documents on transcriptome profiling:
gdc.cancer.gov/about-data/data-harmonization-and-generation/genomic-data-harmonization/high-level-data-generation/rna-seq-quantification * 3. MUTATION DATA: MAF files for glioma patients
were collected from the GDC. Total mutation counts were aggregated for each patient. See GDC documents on MAF files: docs.gdc.cancer.gov/Data/File_Formats/MAF_Format/ Code for processing
this data can be carefully reviewed at the GDC-scala open source repository available at bitbucket.org/insilica/gdc-scala). All data was collected between July and August 2018. TET1 GENE
EXPRESSION KNOCKDOWN EXPERIMENT Data from a TET1 knockdown experiment is provided (Supplemental Table 1). This dataset consists of gene expression signal values for the TET1 knockdown and
control A172 glioma cell lines6. A fold change is calculated by shEV gMeanSignal/shTET1_rMeanSignal. The table has 44,496 rows. Gene names were mapped to ensembl identifiers using BiomaRt50.
Genes could have repeated probes. TET1 CELL MOTILITY KNOCKDOWN EXPERIMENT TET1 knockdown and control cell lines were established as previously described and plated in 6-well tissue culture
treated plates at 600,000 cells per well8. When cells were 80% confluent, a scratch was made with a P1000 pipet tip and the cell-free area (wound) was imaged using a 20X objective (time 0).
The wounds were then tracked and imaged at the times reported. Migration was quantified by calculating the area without cells normalized to the area of the wound at time 0 using Image J.
Average relative area of the wound was calculated over 3–6 images per time point. HALLMARK GENE SETS Cancer hallmark gene sets were selected as described originally in colorectal cancer to
find sets of prognostic hallmark-based gene signatures18. These gene sets are a good selection because of their prognostic relevance and their membership in important cancer hallmark gene
sets. We selected eight gene sets (DNA Repair, Immune Response, Phos1, Phos2, Cell Motility, Cell Cycle, Cell Death, and Apoptosis). These gene sets were reduced to 10–20 genes by removing
genes without complete expression data across all glioma patients. MODEL CREATION Several models were created in this study. Cox proportional hazards models and Kaplan-Meier curves were
created in R. Two classes of neural network models were created: Survival Neural Networks and Multitask Neural Networks. Every model is created and evaluated in cross-validation, including
the concordance and percent mediated effect values. SURVIVAL NETWORKS The SurvivalNet package was used to build neural networks that estimate patient hazard from gene expression16. These
networks combine normal deep learning networks with a Cox proportional hazards output layer and loss function. The gene expression inputs were always log transformed and standard scalar
normalized. The output is patient hazard with a loss function derived from days-to-death and days-to-last-follow-up. The models include the following: (1) _TET1 only model:_ A survival
network with TET1 expression input and patient hazard output; (2) _TET1 affected genes model:_ A model with 12 inputs including TET1 expression and expression of genes with high fold change
in a TET1 knockdown experiment. This model estimates patient hazard as a function of TET1 and its differentially expressed genes; (3) _Hallmark models:_ Eight survival networks using
expression of genes from the selected hallmark; and (4) _Permutation models:_ 50 survival networks built from random selections of 10 genes. The neural network architectures were determined
by Bayesian optimization, for the task of selecting the following proper hyperparameters: dropout rate, number of nodes in the single hidden layer, batch size, and number of epochs.
MULTITASK NETWORKS The Keras Python package (https://keras.io/) was used for construction of multitask neural networks. These multitask networks (one constructed for each hallmark gene set
and permutation set) use log transformed expression of TET1 and its affected genes as inputs, feed-forward hidden layers with rectified linear (ReLU) activations of size 100, and a
regression output for each log transformed expression of genes in respective gene sets. An ADAM optimizer was used. MODEL CONCORDANCE Survival models were evaluated by measuring their
patient concordance. Each survival model generates a numeric hazard value for each patient. Pairs of patients can then be ordered by this hazard value. A concordant count is derived from all
the pairs of patients where the patient with a higher hazard value is known to have died before the patient with a lower survival value. The discordant count tracks all pairs of patients
where the patient with higher hazard is known to have died last. The concordance value is then the concordant count divided by the total (discordant + concordant). Concordance thus partially
tracks pairs of patients where one is lost to follow-up. MEDIATION EXPERIMENT The objective of the mediation experiments was to investigate pathways mediating the TET1 effect on survival
and not to build the strongest possible glioma survival model. Mediation is determined by inputting predicted expression values from multitask models into the pre-trained hallmark survival
networks. The concordance of this composed model is then computed on the set of patient pairs ranked correctly by the TET1 and affected genes’ survival network. This concordance is reported
as the percent mediated effect. Our rationale is that the percent mediated effect does not take into account the mediating models performance on pairs of patients incorrectly predicted by
the TET1 and affected genes’ survival network. This is because patients incorrectly predicted by the base model who are correctly predicted after mediation experiment tell us nothing about
mediation of the base model effect. The percent mediated effect improves upon simply measuring correlation between the hallmark predicted hazard and the base model predicted hazard because
it requires that hallmark gene expression be predicted from base network gene expression. This approach is motivated by traditional mediation analysis51,52. CODE Using the R code can
reproduce this project, including all figures and analyses and Python code available in the repository. https://bitbucket.org/insilica/tet1survival. PACKAGES The below is a list of the
analytics packages used in this work: PYTHON * SURVIVALNET: A Cox proportional hazards output layer is added to a traditional neural network. This output layer allows network parameters to
be fit based on errors derived from survival data. SurvivalNet models are built for (1) TET1 + TET1 affected genes, and (2) all gene set hallmarks. See
https://github.com/CancerDataScience/SurvivalNet * KERAS: Keras is a deep learning package written for Python. We use this package to build multitask neural networks. These multitask
networks have multiple outputs corresponding to expression of different genes. R * GGSIGNIF: Significance calculation and box plots: https://github.com/const-ae/ggsignif * SURVMINER:
Survival curve visualization: https://github.com/kassambara/survminer * SURVIVAL: Basic survival analytics (survival functions, coxph, etc.) * GPLOTS: Hallmark correlation heatmaps53. SCALA
* APACHE SPARK: Used for processing of expression, mutation, and clinical patient files * GDC-SCALA: An open-source client for the Genomic Data Commons API
(https://bitbucket.org/insilica/gdc-scala/src/master/). REFERENCES * Ohgaki, H. & Kleihues, P. Epidemiology and etiology of gliomas. _Acta Neuropathol._ 109, 93–108,
https://doi.org/10.1007/s00401-005-0991-y (2005). Article PubMed Google Scholar * Noch, E. K., Ramakrishna, R. & Magge, R. Challenges in the treatment of glioblastoma: multisystem
mechanisms of therapeutic resistance. _World Neurosurg._ 116, 505–517, https://doi.org/10.1016/j.wneu.2018.04.022 (2018). Article PubMed Google Scholar * Osuka, S. & Van Meir, E. G.
Overcoming therapeutic resistance in glioblastoma: the way forward. _J. Clin. Invest._ 127, 415–426, https://doi.org/10.1172/JCI89587 (2017). Article PubMed PubMed Central Google Scholar
* Louis, D. N. _et al_. The 2016 World Health Organization classification of tumors of the central nervous system: a summary. _Acta Neuropathol._ 131, 803–820,
https://doi.org/10.1007/s00401-016-1545-1 (2016). Article PubMed Google Scholar * Binabaj, M. M. _et al_. The prognostic value of MGMT promoter methylation in glioblastoma: A
meta-analysis of clinical trials. _J. Cell Physiol._ 233, 378–386, https://doi.org/10.1002/jcp.25896 (2018). Article CAS PubMed Google Scholar * Coulter, J. B. _et al_. TET1 deficiency
attenuates the DNA damage response and promotes resistance to DNA damaging agents. _Epigenetics_ 12, 854–864, https://doi.org/10.1080/15592294.2017.1359452 (2017). Article PubMed PubMed
Central Google Scholar * Wu, X. & Zhang, Y. TET-mediated active DNA demethylation: mechanism, function and beyond. _Nat. Rev. Genet._ 18, 517–534, https://doi.org/10.1038/nrg.2017.33
(2017). Article CAS PubMed Google Scholar * Kuhns, K. J., Lopez-Bertoni, H., Coulter, J. B. & Bressler, J. P. TET1 regulates DNA repair in human glial cells. _Toxicol. Appl.
Pharmacol._ 380, 114646, https://doi.org/10.1016/j.taap.2019.114646 (2019). Article CAS PubMed PubMed Central Google Scholar * Orr, B. A., Haffner, M. C., Nelson, W. G.,
Yegnasubramanian, S. & Eberhart, C. G. Decreased 5-hydroxymethylcytosine is associated with neural progenitor phenotype in normal brain and shorter survival in malignant glioma. _PLoS
One_ 7, e41036, https://doi.org/10.1371/journal.pone.0041036 (2012). Article ADS CAS PubMed PubMed Central Google Scholar * Zhang, F. _et al_. 5-hydroxymethylcytosine loss is
associated with poor prognosis for patients with WHO grade II diffuse astrocytomas. _Sci. Rep._ 6, 20882, https://doi.org/10.1038/srep20882 (2016). Article ADS CAS PubMed PubMed Central
Google Scholar * Johnson, K. C. _et al_. 5-Hydroxymethylcytosine localizes to enhancer elements and is associated with survival in glioblastoma patients. _Nat. Commun._ 7, 13177,
https://doi.org/10.1038/ncomms13177 (2016). Article ADS CAS PubMed PubMed Central Google Scholar * Bengio, Y., Courville, A. & Vincent, P. Representation learning: a review and new
perspectives. _IEEE Trans. Pattern Anal. Mach. Intell._ 35, 1798–1828, https://doi.org/10.1109/TPAMI.2013.50 (2013). Article PubMed Google Scholar * Kamesawa H, A. H., Soufi, M. Survival
prediction of squamous cell head and neck cancer patients based on radiomic features selected from lung cancer patients using artificial neural network. _Medical Imaging 2018: Imaging
Informatics for Healthcare, Research, and Applications; 1057918_ Proceedings Volume 10579 (2018). * Yuan, J. _et al_. Integrated analysis of genetic ancestry and genomic alterations across
Cancers. _Cancer Cell_ 34, 549–560 e549, https://doi.org/10.1016/j.ccell.2018.08.019 (2018). Article CAS PubMed PubMed Central Google Scholar * M, S. P. a. C. ConvNets and ImageNet
beyond accuracy: understanding mistakes and uncovering biases.> arXiv:1711.11443 (2017). * Yousefi, S. _et al_. Predicting clinical outcomes from large scale cancer genomic profiles with
deep survival models. _Sci. Rep._ 7, 11707, https://doi.org/10.1038/s41598-017-11817-6 (2017). Article ADS CAS PubMed PubMed Central Google Scholar * Hanahan, D. & Weinberg, R. A.
Hallmarks of cancer: the next generation. _Cell_ 144, 646–674, https://doi.org/10.1016/j.cell.2011.02.013 (2011). Article CAS PubMed Google Scholar * Gao, S. _et al_. Identification and
construction of combinatory cancer hallmark-based gene signature sets to predict recurrence and chemotherapy benefit in stage II colorectal cancer. _JAMA Oncol._ 2, 37–45,
https://doi.org/10.1001/jamaoncol.2015.3413 (2016). Article PubMed Google Scholar * Demsar, J. Statistical comparisons of classifiers over multiple data sets. _J. Machinge Learn. Res._ 7,
1–30 (2006). MathSciNet MATH Google Scholar * Mirchia, K. _et al_. Total copy number variation as a prognostic factor in adult astrocytoma subtypes. _Acta Neuropathol. Commun._ 7, 92,
https://doi.org/10.1186/s40478-019-0746-y (2019). Article CAS PubMed Google Scholar * Grin, I. R. & Zharkov, D. O. Eukaryotic endonuclease VIII-like proteins: new components of the
base excision DNA repair system. _Biochemistry_ 76, 80–93 (2011). CAS PubMed Google Scholar * Post, S. _et al_. Phosphorylation of serines 635 and 645 of human Rad17 is cell cycle
regulated and is required for G(1)/S checkpoint activation in response to DNA damage. _Proc. Natl Acad. Sci. USA_ 98, 13102–13107, https://doi.org/10.1073/pnas.231364598 (2001). Article ADS
CAS PubMed PubMed Central Google Scholar * Hou, S. _et al_. XAB2 functions in mitotic cell cycle progression via transcriptional regulation of CENPE. _Cell Death Dis._ 7, e2409,
https://doi.org/10.1038/cddis.2016.313 (2016). Article CAS PubMed PubMed Central Google Scholar * Maiuri, M. C. _et al_. Control of autophagy by oncogenes and tumor suppressor genes.
_Cell Death Differ._ 16, 87–93, https://doi.org/10.1038/cdd.2008.131 (2009). Article CAS PubMed Google Scholar * Udayakumar, D. & Dynan, W. S. Characterization of DNA binding and
pairing activities associated with the native SFPQ.NONO DNA repair protein complex. _Biochem. Biophys. Res. Commun._ 463, 473–478, https://doi.org/10.1016/j.bbrc.2015.05.024 (2015). Article
CAS PubMed PubMed Central Google Scholar * Lv, J. & Zhao, Z. Binding of LINE-1 RNA to PSF transcriptionally promotes GAGE6 and regulates cell proliferation and tumor formation _in
vitro_. _Exp. Ther. Med._ 14, 1685–1691, https://doi.org/10.3892/etm.2017.4667 (2017). Article CAS PubMed PubMed Central Google Scholar * Mu, H., Geacintov, N. E., Broyde, S., Yeo, J.
E. & Scharer, O. D. Molecular basis for damage recognition and verification by XPC-RAD23B and TFIIH in nucleotide excision repair. _DNA Repair._ 71, 33–42,
https://doi.org/10.1016/j.dnarep.2018.08.005 (2018). Article CAS PubMed PubMed Central Google Scholar * Sacco, J. J. _et al_. The deubiquitylase Ataxin-3 restricts PTEN transcription in
lung cancer cells. _Oncogene_ 33, 4265–4272, https://doi.org/10.1038/onc.2013.512 (2014). Article CAS PubMed Google Scholar * Shi, Z. _et al_. Ataxin-3 promotes testicular cancer cell
proliferation by inhibiting anti-oncogene PTEN. _Biochem. Biophys. Res. Commun._ 503, 391–396, https://doi.org/10.1016/j.bbrc.2018.06.047 (2018). Article CAS PubMed Google Scholar *
Rivera Vargas, T., Humblin, E., Vegran, F., Ghiringhelli, F. & Apetoh, L. TH9 cells in anti-tumor immunity. _Semin. Immunopathol._ 39, 39–46, https://doi.org/10.1007/s00281-016-0599-4
(2017). Article CAS PubMed Google Scholar * Chen, S. H., Benveniste, E. N. & Oncostatin, M. a pleiotropic cytokine in the central nervous system. _Cytokine Growth Factor. Rev._ 15,
379–391, https://doi.org/10.1016/j.cytogfr.2004.06.002 (2004). Article CAS PubMed Google Scholar * Roosnek, E. _et al_. Tumors that look for their springtime in APRIL. _Crit. Rev. Oncol.
Hematol._ 72, 91–97, https://doi.org/10.1016/j.critrevonc.2009.01.006 (2009). Article CAS PubMed Google Scholar * Podojil, J. R. & Miller, S. D. Potential targeting of B7-H4 for the
treatment of cancer. _Immunol. Rev._ 276, 40–51, https://doi.org/10.1111/imr.12530 (2017). Article CAS PubMed PubMed Central Google Scholar * Giese, A. _et al_. Dichotomy of
astrocytoma migration and proliferation. _Int J Cancer_ 67, 275-282, 10.1002/(SICI)1097-0215(19960717)67:2<275::AID-IJC20>3.0.CO;2-9 (1996). Article CAS PubMed Google Scholar *
Codo, P. _et al_. Control of glioma cell migration and invasiveness by GDF-15. _Oncotarget_ 7, 7732–7746, https://doi.org/10.18632/oncotarget.6816 (2016). Article PubMed PubMed Central
Google Scholar * Bakhoum, S. F. & Landau, D. A. Chromosomal instability as a driver of tumor heterogeneity and evolution. _Cold Spring Harb Perspect Med_ 7,
https://doi.org/10.1101/cshperspect.a029611 (2017). Article PubMed PubMed Central Google Scholar * McGranahan, N. & Swanton, C. Clonal heterogeneity and tumor evolution: past,
present, and the future. _Cell_ 168, 613-628, 10.1016/j.cell.2017.01.018 (2017). * Yao, Y. _et al_. B7-H4(B7x)-Mediated cross-talk between glioma-lnitiating cells and macrophages via the
IL6/JAK/STAT3 pathway lead to poor prognosis in glioma patients. _Clin. Cancer Res._ 22, 2778–2790, https://doi.org/10.1158/1078-0432.CCR-15-0858 (2016). Article CAS PubMed PubMed Central
Google Scholar * Jiang, J. _et al_. Tumor expression of B7-H4 predicts poor survival of patients suffering from gastric cancer. _Cancer Immunol. Immunother._ 59, 1707–1714,
https://doi.org/10.1007/s00262-010-0900-7 (2010). Article CAS PubMed Google Scholar * Arigami, T. _et al_. Expression of B7-H4 in blood of patients with gastric cancer predicts tumor
progression and prognosis. _J. Surg. Oncol._ 102, 748–752, https://doi.org/10.1002/jso.21722 (2010). Article PubMed Google Scholar * Tan, Z. & Shen, W. Prognostic role of B7-H4 in
patients with non-small cell lung cancer: A meta-analysis. _Oncotarget_ 8, 27137–27144, https://doi.org/10.18632/oncotarget.15648 (2017). Article PubMed PubMed Central Google Scholar *
Wang, W., Xu, C., Wang, Y., Yu, L. & Zhang, X. Prognostic values of B7-H4 in non-small cell lung cancer. _Biomarkers_, 1-16, https://doi.org/10.1080/1354750X.2016.1203997 (2016). *
Zhang, B. _et al_. ER stress induced by ionising radiation in IEC-6 cells. _Int. J. Radiat. Biol._ 86, 429–435, https://doi.org/10.3109/09553001003668014 (2010). Article CAS PubMed Google
Scholar * Chandwaskar, R. & Awasthi, A. Emerging roles of Th9 cells as an anti-tumor helper T cells. _Int Rev Immunol_, 1-8, https://doi.org/10.1080/08830185.2019.1648453 (2019).
Article CAS PubMed Google Scholar * Fang, Y. _et al_. IL-9 inhibits HTB-72 melanoma cell growth through upregulation of p21 and TRAIL. _J. Surg. Oncol._ 111, 969–974,
https://doi.org/10.1002/jso.23930 (2015). Article CAS PubMed Google Scholar * Qiu, Z. _et al_. HMGCR positively regulated the growth and migration of glioblastoma cells. _Gene_ 576,
22–27, https://doi.org/10.1016/j.gene.2015.09.067 (2016). Article CAS PubMed Google Scholar * Uchida, H. _et al_. Role of sonic hedgehog signaling in migration of cell lines established
from CD133-positive malignant glioma cells. _J. Neurooncol_ 104, 697–704, https://doi.org/10.1007/s11060-011-0552-2 (2011). Article CAS PubMed Google Scholar * Tu, Y. _et al_. Smoothened
is a poor prognosis factor and a potential therapeutic target in glioma. _Sci. Rep._ 7, 42630, https://doi.org/10.1038/srep42630 (2017). Article ADS CAS PubMed PubMed Central Google
Scholar * Salhia, B. _et al_. The guanine nucleotide exchange factors trio, Ect2, and Vav3 mediate the invasive behavior of glioblastoma. _Am. J. Pathol._ 173, 1828–1838,
https://doi.org/10.2353/ajpath.2008.080043 (2008). Article CAS PubMed PubMed Central Google Scholar * Durinck, S., Spellman, P. T., Birney, E. & Huber, W. Mapping identifiers for
the integration of genomic datasets with the R/Bioconductor package biomaRt. _Nat. Protoc._ 4, 1184–1191, https://doi.org/10.1038/nprot.2009.97 (2009). Article CAS PubMed PubMed Central
Google Scholar * Baron, R. M. & Kenny, D. A. The moderator-mediator variable distinction in social psychological research: conceptual, strategic, and statistical considerations. _J.
Pers. Soc. Psychol._ 51, 1173–1182, https://doi.org/10.1037//0022-3514.51.6.1173 (1986). Article CAS PubMed Google Scholar * MacKinnon, D. P. _Introduction to Statistical Mediation
Analysis_. (Erlbaum., 2008). * Warnes, G. R. _et al_. _Various R programming tools for plotting data_. _R Package_. Vol. 2.4 (2009). Download references ACKNOWLEDGEMENTS The research was
supported, in part, by a grant from the National Capital Cancer Research Fund. Katie Kuhns was supported by NIEHS Training Grant ES07141. Dr. Laterra’s research grants include R01NS096754
and R01NS110087. AUTHOR INFORMATION AUTHORS AND AFFILIATIONS * Insilica LLC, 2736 Quarry Heights Way, Baltimore, MD, USA Thomas Luechtefeld & Nole Lin * Johns Hopkins Sidney Kimmel
Comprehensive Cancer Center, Baltimore, MD, USA Channing Paller & John J. Laterra * Department of Environmental Health and Engineering, Bloomberg School of Public Health, Johns Hopkins
University, Baltimore, MD, USA Katherine Kuhns & Joseph P. Bressler * Kennedy-Krieger Institute, Baltimore, MD, USA John J. Laterra & Joseph P. Bressler Authors * Thomas Luechtefeld
View author publications You can also search for this author inPubMed Google Scholar * Nole Lin View author publications You can also search for this author inPubMed Google Scholar *
Channing Paller View author publications You can also search for this author inPubMed Google Scholar * Katherine Kuhns View author publications You can also search for this author inPubMed
Google Scholar * John J. Laterra View author publications You can also search for this author inPubMed Google Scholar * Joseph P. Bressler View author publications You can also search for
this author inPubMed Google Scholar CONTRIBUTIONS Thomas Luechtefeld, Nole Lin and Katherine K. Kuhn performed the experiments. Channing Paller, Thomas Luechtefeld, John Laterra, Joseph P.
Bressler interpreted the results. Thomas Luechtefeld and Joseph P. Bressler wrote the paper. CORRESPONDING AUTHOR Correspondence to Joseph P. Bressler. ETHICS DECLARATIONS COMPETING
INTERESTS The authors declare no competing interests. ADDITIONAL INFORMATION PUBLISHER’S NOTE Springer Nature remains neutral with regard to jurisdictional claims in published maps and
institutional affiliations. SUPPLEMENTARY INFORMATION SUPPLEMENTARY INFORMATION SUPPLEMENTAL DATA SET. RIGHTS AND PERMISSIONS OPEN ACCESS This article is licensed under a Creative Commons
Attribution 4.0 International License, which permits use, sharing, adaptation, distribution and reproduction in any medium or format, as long as you give appropriate credit to the original
author(s) and the source, provide a link to the Creative Commons license, and indicate if changes were made. The images or other third party material in this article are included in the
article’s Creative Commons license, unless indicated otherwise in a credit line to the material. If material is not included in the article’s Creative Commons license and your intended use
is not permitted by statutory regulation or exceeds the permitted use, you will need to obtain permission directly from the copyright holder. To view a copy of this license, visit
http://creativecommons.org/licenses/by/4.0/. Reprints and permissions ABOUT THIS ARTICLE CITE THIS ARTICLE Luechtefeld, T., Lin, N., Paller, C. _et al._ Measuring Cancer Hallmark Mediation
of the TET1 Glioma Survival Effect with Linked Neural-Network Based Mediation Experiments. _Sci Rep_ 10, 8886 (2020). https://doi.org/10.1038/s41598-020-65369-3 Download citation * Received:
07 November 2019 * Accepted: 21 April 2020 * Published: 01 June 2020 * DOI: https://doi.org/10.1038/s41598-020-65369-3 SHARE THIS ARTICLE Anyone you share the following link with will be
able to read this content: Get shareable link Sorry, a shareable link is not currently available for this article. Copy to clipboard Provided by the Springer Nature SharedIt content-sharing
initiative