Transcriptome analysis in roots and leaves of wheat seedlings in response to low-phosphorus stress
- Select a language for the TTS:
- UK English Female
- UK English Male
- US English Female
- US English Male
- Australian Female
- Australian Male
- Language selected: (auto detect) - EN
Play all audios:
Low phosphorus availability is a major abiotic factor constraining wheat growth. The molecular mechanisms of the wheat whole genome under low-phosphorus stress are still unclear. To obtain
information on gene expression in wheat seedlings under low-phosphorus stress, transcriptome sequencing was performed on roots and leaves. The results showed that 2,318 (1,646 upregulated
and 672 downregulated) transcripts were differentially expressed in the leaves, and 2,018 (1,310 upregulated and 708 downregulated) were differentially expressed in the roots. Further
analysis showed that these differentially expressed genes (DEGs) were mainly enriched in carbon fixation in photosynthetic organs and in carbon metabolism, photosynthesis, glyoxylate and
dicarboxylate metabolism and plant-pathogen interaction in both leaves and roots. These pathways were mainly associated with environmental adaptation, energy metabolism and carbohydrate
metabolism, suggesting that the metabolic processes were strengthened in wheat seedlings under low-phosphorus stress and that more energy and substances were produced to resist or adapt to
this unfavourable environment. This research might provide potential directions and valuable resources to further study wheat under low-phosphorus stress.
Phosphorus (P) is an essential macronutrient for plant growth and development and plays a key role in the regulation of energy metabolism and the synthesis of nucleic acids and membranes1,2.
Though abundant in soil, it is often limited for plants due to its low bioavailability3. Low-phosphorus stress seriously restricts crop growth and reduces the yield of crops4,5. To obtain
high yields, excessive quantities of P-fertilizer are applied by farmers. Unfortunately, crops can only utilize up to 30% of inorganic phosphate (Pi) from fertilizers because the
inaccessible forms are formed from its reaction with iron-aluminium oxides and calcium carbonate compounds6,7. The remaining phosphorus is fixed in the soil or transferred to groundwater,
lakes and oceans through farmland drainage and surface runoff, leading to water eutrophication and algal blooms8,9. Understanding the molecular mechanism of crops’ responses to
low-phosphorus stress and improving their phosphorus use efficiency is an important means to solve these problems.
Transcriptome profiling using next-generation sequencing technologies can detect the molecular mechanisms of plant responses to abiotic stress10,11. Some studies have been conducted on plant
responses to low-phosphorus stress. In barley (Hordeum vulgare L.), transcriptome analysis revealed that many genes were significantly upregulated or downregulated in response to
low-phosphorus stress, and the DEGs were mainly involved in phosphorus metabolism, such as phospholipid degradation, sucrose synthesis, phosphorylation/dephosphorylation, hydrolysis of
phosphoric enzymes and post-transcriptional regulation12. It was also reported that the DEGs were enriched in the oxidation-reduction process, carbohydrate metabolic process, biosynthetic
process, and tricarboxylic acid cycle of oat roots under low-P treatment13. To better understand these processes, the DEGs were also investigated under low-phosphorus stress in other crops
through transcriptome analysis, such as maize14, rice15, and soybean16. Transcriptome analysis has greatly improved insights into the sophisticated molecular mechanisms regulating phosphorus
homeostasis in numerous cultivated crops. However, little research has been conducted on the response of wheat to low-phosphorus stress.
Wheat is one of the main cultivated crops in the worldwide food system. To meet the needs of the world’s growing population, the grain yield of wheat must increase at an average annual rate
of approximately 2% in a limited area of cultivated land17. However, wheat yield is frequently threatened by low-phosphorus stress, especially in acidic and alkaline soils in tropical and
subtropical regions18,19. Therefore, improving the phosphorus use efficiency and biomass yield of wheat under low-phosphorus conditions has great practical significance.
In this paper, we analysed the wheat responses to low-phosphorus stress using transcriptome analysis. The transcriptome profile will provide more information on the wheat gene sequence
related to phosphorus efficiency, and the identification of DEGs following low-phosphorus stress can deepen our understanding of the genetic variation of wheat under low-phosphorus stress
and suggest strategies to enhance their phosphorus use efficiency and biomass production with less fertilizer application.
Low-phosphorus stress significantly inhibited the growth of wheat seedlings. Under low-phosphorus stress, plant height, shoot dry weight, root dry weight and total root length of wheat
seedlings were significantly lower than those of the CK, by 24.76%, 26.75%, 45.66% and 45.10%, respectively (Table 1). Additionally, the total phosphorus uptake of low-phosphorus-treated
seedlings was significantly decreased by 69.28% compared with the CK (Table 1).
To understand the molecular mechanism of the response of wheat seedlings to low-phosphorus stress, the gene expression of wheat seedlings under low-phosphorus stress was investigated by
transcriptome sequencing. In total, 43.22, 47.08, 45.63 and 41.25 million raw reads were obtained by Illumina sequencing of the -P-L, -P-R, CK-L and CK-R cDNA libraries, respectively (Table
2). After filtering low-quality reads, 42.80 (-P-L), 46.46 (-P-R), 45.10 (CK-L), and 40.73 million clean reads (CK-R) (Q20 > 95.07%) were generated as shown in Table 2, the GC content of
which was between 54.26% and 55.38%. The error rate of all clean data per sample was controlled below 0.02%. A total of 71.06~84.43% of these clean reads were mapped to the wheat genome
(Table 2). Of the mapped data, 91.94~93.69% of the clean reads were uniquely mapped to the genome.
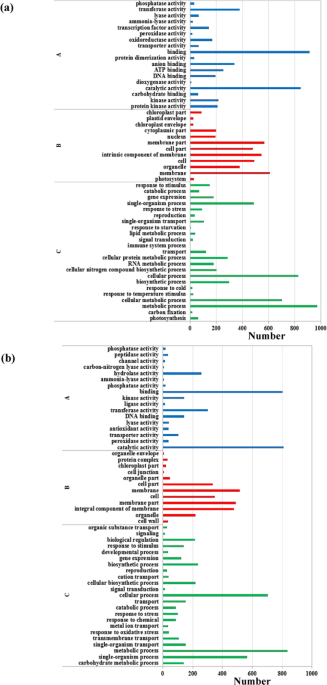
The sequences of unigenes were searched against the Gene Ontology (GO) database and the Kyoto Encyclopedia of Genes and Genomes (KEGG) database. GO analysis showed that genes were defined in
three major functional categories: molecular function, cellular component and biological process. In total, these unigenes were further classified into 53 and 52 subcategories in the leaves
and roots, respectively. Unigenes involved in binding, catalytic activity, membrane, membrane part, intrinsic component of membrane, metabolic process, cellular process and single-organism
process in leaves and roots were the most enriched subcategories (Fig. 1a,b).
GO classification of assembled unigenes in wheat leaves (a) and roots (b). (A) Molecular function. (B) Cellular component. (C) Biological process.
The KEGG database was used to identify the metabolic pathways that may be fully or partially represented by annotated coding sequences of unigenes. A total of 18414 unigenes in leaves (9330
unigenes) and roots (9084 unigenes) were assigned to five categories containing 30 KEGG pathways. Among them, carbohydrate metabolism, signal transduction, amino acid metabolism, overview
and translation in leaves and roots were the five most strongly represented pathways (Fig. 2a,b).
KEGG classification of assembled unigenes in wheat leaves (a) and roots (b). (A) Organismal systems. (B) Cellular processes. (C) Genetic information processing. (D) Environmental information
processing. (E) Metabolism.
DESeq software was used to discriminate genes that were differentially expressed in response to low-phosphorus stress. An absolute value of log 2FoldChange > 1 and p-value