Multiple sources and sinks of dissolved inorganic carbon across Swedish streams, refocusing the lens of stable C isotopes
- Select a language for the TTS:
- UK English Female
- UK English Male
- US English Female
- US English Male
- Australian Female
- Australian Male
- Language selected: (auto detect) - EN
Play all audios:
It is well established that stream dissolved inorganic carbon (DIC) fluxes play a central role in the global C cycle, yet the sources of stream DIC remain to a large extent unresolved. Here,
we explore large-scale patterns in δ13C-DIC from streams across Sweden to separate and further quantify the sources and sinks of stream DIC. We found that stream DIC is governed by a
variety of sources and sinks including biogenic and geogenic sources, CO2 evasion, as well as in-stream processes. Although soil respiration was the main source of DIC across all streams, a
geogenic DIC influence was identified in the northernmost region. All streams were affected by various degrees of atmospheric CO2 evasion, but residual variance in δ13C-DIC also indicated a
significant influence of in-stream metabolism and anaerobic processes. Due to those multiple sources and sinks, we emphasize that simply quantifying aquatic DIC fluxes will not be sufficient
to characterise their role in the global C cycle.
Despite rapid progress over the past decades to estimate stream DIC fluxes at the global1, 2, regional3,4,5 and catchment scales6,7,8, their sources still remain to a large extent
unresolved. The sources of stream DIC can be diverse, ranging from biological9,10,11 to geological2, 12, and terrestrial4, 13,14,15 or aquatic16,17,18. While multiple studies have succeeded
to define DIC sources at catchment scales15, 19, 20, there are fewer examples of such attempts across large landscape units11, 21, 22. The lack of tools to effectively characterize DIC
sources across multiple catchments without requiring mass balance exercises or controlled experiments is one of the key reasons for this persistent knowledge gap. The stable carbon isotope
value of DIC,13C-DIC/12C-DIC (δ13C-DIC) bears the imprint of multiple processes that shape the stream DIC. This makes it an attractive tool for deciphering the DIC sources. But the
interpretation of large scale patterns in stream δ13C-DIC is known for being challenging and often results in limited outcomes. While a number of studies have analysed downstream changes in
δ13C-DIC along large stream networks9, 23,24,25,26, none to our knowledge have attempted to interpret δ13C-DIC values across multiple individual catchments from different regions.
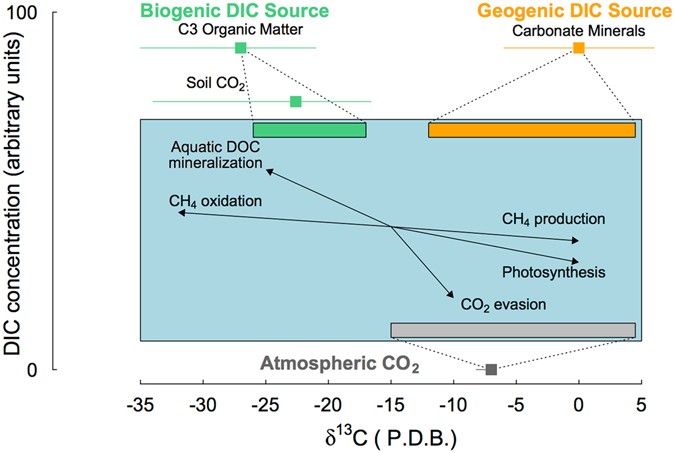
Conceptual scheme illustrating biogeochemical processes controlling stream δ13C-DIC values in streams, adapted from Amiotte-Suchet et al.41 and Alling et al.75. The x-axis represents the
reported range of stream δ13C-DIC values and y-axis a gradient in DIC concentration with arbitrary units. The internationally agreed δ13C end-members for the biogenic (−27‰) DIC source in a
C3 catchment (green square) and geogenic (0‰) DIC source (orange) as well as the atmospheric CO2 (−8.5‰) are represented with their documented range (coloured bars) from Coplen et al.78. The
blue box represents the stream water environment, with the commonly accepted range of δ13C-DIC values in equilibrium with each of these three end-members (Biogenic (−26 to −18‰), Geogenic
(−12‰ to 5‰), Atmospheric (−15% to 8‰), represented in coloured rectangles, along with the isotopic effect of in-stream biogeochemical processes represented as the black arrows.
Stream δ13C-DIC values can be shaped by more than just terrestrial export of biogenic or geogenic DIC, and atmospheric CO2 evasion24, 41, 42. Stream δ13C-DIC values can carry the influence
of additional biogeochemical processes including: weathering of silicate minerals26, 43, 44, in-stream respiration45,46,47, DOC photo-oxidation48, 49, photosynthesis28, 50,51,52, and
anaerobic metabolism53,54,55 (Fig. 1). Together, this complex mixture of sources and sinks with associated isotopic effects causes the stream δ13C-DIC to vary across a wide range, typically
from +5‰ to −35‰ (Fig. 1). Failure to separate the different processes and influences on the δ13C-DIC can lead to incorrect interpretation of the sources and sinks of DIC in streams.
Here, we aimed to determine the sources and sinks of DIC across multiple streams and regions by exploring large-scale patterns in δ13C-DIC values. Stream δ13C-DIC data from 318 streams of
Strahler stream order 1 to 5, with particular emphasis on headwater streams, were included. The streams were distributed across a large geographic and climatic range in Sweden (Fig. 2). To
our knowledge, this represents the most extensive dataset on stream δ13C-DIC published to date. We tested a conceptual model where the stream DIC is a product of three end-members including
two terrestrial DIC sources, biogenic and geogenic, as well as exchange with atmospheric CO2 (Fig. 1). We hypothesised that deviation from this scheme will be widespread across streams, with
additional DIC sources and sinks, linked to in-stream metabolism and anaerobic processes contribute significantly to stream DIC. We explored the application of graphical mixing model
techniques (Keeling and Miller-Tans plots) to identify and separate DIC sources across streams and regions (Fig. S1). We further combined these techniques with an inverse modelling approach,
based on Venkiteswaran et al.39, to characterize the influence of CO2 evasion on the observed δ13C-DIC values, from which we relate the residual variance to additional DIC sources and
sinks. With this approach, we were able to separate and quantify multiple processes that drive stream DIC fluxes across individual catchments and regions.
Map of sampled streams across the different regions included in this study (LAVI, DAL, KRY, ABI). Circles represent individual stream sampling locations and are colour coded according to
their δ13C-DIC values, expressed in per mille (‰). Calcium carbonate containing bedrocks (limestone, dolomite and marble), representing a potential geogenic DIC source, are identified in
dark grey, while silicate rich rocks (sandstone, quartz, rhyolite and granite) are identified in light grey and rocks that are very resistant to weathering (basalt, gabbro, metagreywacke and
amphibolites) are identified in white, The map was generated using ArcMap 10.3.1 (http://www.esri.com/), with the information for the background geological map (bedrock 1:50 000–1:250 000)
obtained from © Geological Survey of Sweden (SGU).
The DIC concentrations ranged from 0.7 to 33.0 mg C L−1 across all streams, a similar range as observed for the stream DOC concentration, which varied from 0.3 to 84.4 mg C L−1 (Table 1).
The stream DIC and CO2 concentration differed significantly between the regions, with the exception of KRY and LAVI. (Table 1, Table S2). The streams of KRY and LAVI both had the highest
median CO2 concentration and lowest pH and alkalinity (Table 1). The median DIC concentrations were highest in the ABI and DAL streams, where the streams also had a circumneutral pH. The
stream DOC concentration was significantly different between all four regions, with the highest median concentration observed in the streams of LAVI followed in decreasing order by the KRY,
DAL and ABI regions (Table 1, Table S2). This large variability in stream C concentrations made the DOC:DIC ratio vary across four orders of magnitude (from 0.04 to 61) in the studied
streams. The DOC:DIC ratio significantly decreased with altitude (m.a.s.l), following a semi-logged relationship:
Thus, DOC was the dominant form of dissolved C in the lowlands, while DIC was more prominent in alpine or high altitude (>450 m.a.s.l) areas (Table 1, Table S1). There was a negative
relationship between stream pH and DOC concentration (mg C L−1) across all streams (Fig. S3).
The Ca concentration was significantly different across all four regions, except in KRY and LAVI where the median Ca concentrations were also lowest (Table 1, Table S2). The median Ca
concentration in the ABI streams was more than double that of the streams in LAVI, DAL and KRY (Table 1).
The stream δ13C-DIC values varied from −27.6‰ to −0.6‰, and were significantly different between all four regions, with the most negative median values found in LAVI, and the most positive
values in ABI (Fig. 2, Table 1, Table S2). The stream δ13C-DIC values were most variable in the ABI region, with a coefficient of variation (CV) of 66%, followed by 31% in DAL, 15% in KRY
and 14% in LAVI. There was a strong positive relationship between stream pH and δ13C-DIC across all streams (Fig. 3a):
Scatterplots showing (a) the relationship between δ13C-DIC as a function of pH, with the solid black line representing the least square linear regression model, the green area representing
δ13C-DIC in equilibrium with soil CO2 (−23 to −28‰), the grey area representing equilibrium with atmospheric CO2 (−8.5‰) the orange area representing the conventional threshold where
geogenic DIC sources are considered possible, (b) the δ13C-DIC values compared with the calculated δ13C-CO2 values across all streams and regions with a dotted line representing the 1:1
ratio, and (c) the relationship between the calculated δ13C-CO2 values as a function of DOC concentration with the solid line representing the linear regression model. Each dot represents a
different stream observation and is coloured according to its region (DAL, LAVI, KRY and ABI).
This relationship corresponded to a negative relationship between the δ13C-DIC values and the CO2:DIC ratio:
There was a significant difference in average δ13C-DIC values between stream orders for the two regions including stream orders >1 (KRY p