A dataset on survey designs and quality of social and behavioral science surveys during the covid-19 pandemic
- Select a language for the TTS:
- UK English Female
- UK English Male
- US English Female
- US English Male
- Australian Female
- Australian Male
- Language selected: (auto detect) - EN
Play all audios:
ABSTRACT In the social and behavioral sciences, surveys are frequently used to collect data. During the COVID-19 pandemic, surveys provided political actors and public health professionals
with timely insights on the attitudes and behaviors of the general population. These insights were key in guiding actions to fight the pandemic. However, the data quality of these surveys
remains unclear because systematic knowledge about how the survey data were collected during the COVID-19 pandemic is lacking. This is unfortunate, since decades of survey research have
shown that survey design impacts data. Our Survey Data Collection and the COVID-19 Pandemic (SDCCP) project deals with this research gap. We collected rich metadata on survey design for 717
social and behavioral science surveys carried out in Germany during the first two years of the COVID-19 pandemic. In this data descriptor, we present a unique resource for a systematic
assessment of the survey data collection practices and quality of surveys conducted in Germany during the COVID-19 pandemic. SIMILAR CONTENT BEING VIEWED BY OTHERS MEASURING SOCIAL
DETERMINANTS OF HEALTH IN THE _ALL OF US_ RESEARCH PROGRAM Article Open access 16 April 2024 COVIDISTRESS GLOBAL SURVEY DATASET ON PSYCHOLOGICAL AND BEHAVIOURAL CONSEQUENCES OF THE COVID-19
OUTBREAK Article Open access 04 January 2021 ASSESSING SCALE RELIABILITY IN CITIZEN SCIENCE MOTIVATIONAL RESEARCH: LESSONS LEARNED FROM TWO CASE STUDIES IN UGANDA Article Open access 13
March 2024 BACKGROUND & SUMMARY During the COVID-19 pandemic, social and behavioral data provided political actors and public health professionals with an empirical basis for guiding
their actions in fighting the pandemic1. In the social and behavioral sciences, surveys are an important technique to gather data on the attitudes and behavior of the (general) population.
Consequently, examples of the survey data collected during the COVID-19 pandemic include specialized fit-for-purpose surveys such as the COVIDiSTRESS Global Survey2 and COVID-19-adjusted
modules/and supplemental waves in existing and on-going general-purpose surveys such as the Mannheim Corona Study (MCS) in the German Internet Panel (GIP)3, the SOEP-CoV as part of the
German Socio-Economic Panel (SOEP)4, and the tracking of COVID-19 effects in the Understanding America Study (UAS)5. Survey data collection did not remain unaffected by the sudden COVID-19
outbreak in early 2020 as contributions in a special issue of Survey Research Methods detail6. In response to the pandemic, non-pharmaceutical interventions were put in place such as contact
restrictions, stay-at-home orders, and closed public services/stores7. In response to these interventions, surveys began to adapt their designs to ensure that data could be collected. For
example, to conclude their fieldwork that was interrupted by the COVID-19 outbreak, the German Family Panel (pairfam) switched from a face-to-face mode (F2F) to computer assisted telephone
interviewing (CATI)8. Similarly, the Panel Study of Income Dynamics (PSID) also switched from F2F to CATI for their Transition into Adulthood Supplement (TAS-19)9. The Family Research and
Demographic Analysis (FReDA) panel switched their recruitment mode from F2F to self-administered modes (mail, web)8. In line with these shifts away from F2F, the Understanding Society panel
also abandoned the F2F mode10. Despite the challenges imposed by the COVID-19 pandemic, survey research was able to continue data collection. In Germany, the German Data Forum (RatSWD) lists
and briefly describes around 300 COVID-19-related surveys11. As detailed above, a few large-scale surveys described the necessary changes made to their survey design and operations
protocols to ensure that fieldwork could be conducted. However, in general it remains an open question as to how survey data were collected during the COVID-19 pandemic, especially when
considering the plethora of surveys that were not large-scale operations that had the resources to report their struggles and design decisions. In other words, it remains unclear which
survey designs were used during this period to collect data. Decades of survey research have highlighted that survey design impacts the quality of collected data12,13. Moreover, the COVID-19
pandemic itself may have affected survey measures in the form of a period effect. First, nonresponse bias may have been introduced into the data due to an expected correlation between
COVID-19 infections and survey participation14,15. Second, the use of retrospective questions to assess respondent characteristics before the outbreak may have introduced measurement error
at the respondent level16. Unfortunately, researchers not only lack knowledge about how surveys were collected during the COVID-19 pandemic but also, as a consequence, the data quality of
this important basis for research, policy consultation, and political actions remains unaccounted for. The Survey Data Collection and the COVID-19 Pandemic (SDCCP) project was funded by the
German Federal Ministry for Education and Research (BMBF) from 2021 to 2025 to deal with the existing research gap on survey data collection practices and data quality. For this purpose, we
investigate how survey data were collected during the pandemic and analyze the quality of the data that was used to consult political actors and conduct research. To answer these research
questions, as part of the SDCCP project, we aimed to collect rich metadata and information about survey design for all the social science surveys that were conducted in Germany between the
COVID-19 outbreak in Germany from March 2020 and December 2021. We focused only on those surveys that targeted the German general population. As part of the project, we published the SDCCP
dataset for re-use by research. This unique dataset is a systematic assessment of survey data collection practices in Germany during the COVID-19 outbreak (N = 717). It enables social
science methodologists to assess questions of survey design and quality. In addition, the SDCCP dataset is a unique source of information on how scientific data were collected in a
challenging environment. Moreover, this dataset can be used to supplement substantive analyses with survey design information. Enriching datasets with methodological information could be
especially useful when aggregating data from different surveys that differ in how they collected data. Consequently, our goal with the present data descriptor is to detail our data
collection approach and illustrate our dataset so to facilitate its use by other researchers. METHODS CASE SELECTION The SDCCP dataset includes information on the design of surveys conducted
during the COVID-19 pandemic. To define which surveys to select for inclusion in our dataset, we established a list of survey eligibility criteria: * 1. _Survey country:_ Surveys eligible
for inclusion in the dataset must have been conducted in Germany. Cross-national surveys also were considered eligible provided that a sub-sample was collected in Germany. In these cases,
coding was restricted to the German sub-sample. Furthermore, eligible surveys had to target the entire country. We excluded surveys targeting only specific geographic areas (e.g., only
certain federal states). * 2. _Time period:_ We only considered surveys with fieldwork starting between March 1, 2020 and December 31, 2021. * 3. _Data type:_ Eligible cases included
academic quantitative surveys with voluntary participation. * 4. _Topic:_ Eligible surveys had to be conducted in the field of social sciences and/or health research. * 5. _Target
population:_ Eligible surveys had to target individuals from the German general population. Surveys targeting very large population subgroups (e.g., individuals of a certain age range,
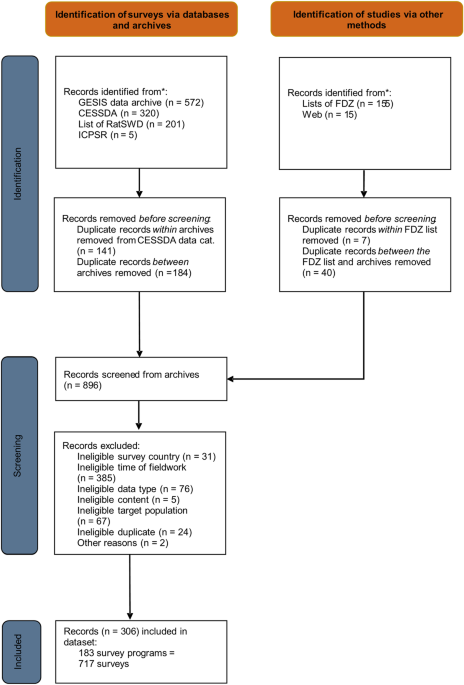
students, or workers) also were considered eligible. Based on these eligibility criteria, we conducted a three-step case selection process that we depicted as a flow diagram based on the
PRISMA guidelines in Fig. 117. First, we identified potentially eligible surveys by searching the following repositories and lists of data collection efforts for surveys conducted in Germany
during the relevant time period: GESIS Data Archive for the Social Sciences, Consortium of European Social Science Data Archives (CESSDA), RatSWD list of COVID-19 surveys, Inter-university
Consortium for Political and Social Research (ICPSR), and data centres of the German Data Forum (FDZ). Our selection of repositories included the major German archive for quantitative social
science data to which we added its European (CESSDA) and international counterparts (ICSPR) for completeness. To further incorporate surveys not covered by these repositories, we decided to
include the above-mentioned lists to further enhance the completeness of our selection. Moreover, we searched for surveys that were mentioned in documentations, websites, or reports of the
surveys we found in the repositories and lists but that were not included in the above-listed sources (category “web”). Our approach aimed to include as many surveys as possible in a
systematic way, while also focusing on sources from which we were expecting to at least get some very basic and systematic information that was required to determine the eligibility of the
cases. Given the extent of their content, we are convinced that the repositories and the RatSWD list cover the majority of social science surveys conducted during the COVID-19 pandemic in
Germany. When available, we used filters in the repositories and lists that matched our eligibility criteria to adjust the scope of our searches. After the removal of duplicates, this step
resulted in a list of 896 records. Second, we screened the identified records for eligibility based on the publicly available information for each dataset (website, data documentation,
method reports, etc.). For this purpose, we used our list of eligibility criteria in a hierarchical order, and we coded the first unfulfilled criterion as the reason for exclusion. As an
illustration, a survey conducted in February 2020 with school staff did not fulfill criterion 2 (time period) or criterion 5 (target population), but we assigned its ineligibility only to
criterion 2 due to its higher position in the hierarchy. If we could not determine a survey’s eligibility due to missing information, we did not include it in the dataset. We conducted the
identification and screening process between September and November 2022. After the removal of ineligible records, 306 records remained. Third, the remaining 306 records were coded what
resulted in the SDCCP dataset. The final SDCCP dataset included 183 survey programs. We defined a _survey program_ as having a common survey initiator and theme, and it may consist of
multiple surveys (e.g., waves). In the SDCCP dataset, a _survey_ is the unit of analysis (i.e., one row in the dataset). However, in a few cases (3.6% of all rows in the final dataset) no
wave-specific information was available, but rather aggregated information referring to more than one wave. In these cases, we coded the survey program as one row incorporating the
aggregated information we were able to obtain. To enable data users to identify these cases, we created a variable (v6) indicating for each row in the dataset how many individual surveys are
represented by that row (see Usage Notes). In the final dataset, coding the 183 survey programs resulted in a sample size of 717 surveys. CODING SCHEME The SDCCP dataset was designed to
answer the project’s research questions related to survey design and data quality, and for reuse by scholars interested in research designs. For a holistic assessment of survey data quality,
we relied on three well-established frameworks: the Total Survey Error (TSE) framework13,18,19, the Total Survey Quality (TSQ) framework20, and the FAIR Data Principles framework21. These
frameworks differ in their definitions of data quality. On the one hand, the TSE framework understands data quality as the accuracy of survey statistics. The focus on accuracy corresponds
with the quality perception of data producers. On the other hand, the FAIR Data Principles framework emphasizes the quality aspects that are important for data users, such as the
availability of information on the study design and the availability of survey data. The Total Survey Quality framework combines both perspectives, since it considers accuracy and
user-centered quality dimensions. By combining the interests of data producers and data users, the coding scheme applied in the SDCCP dataset enables a multi-dimensional assessment of survey
data quality with respect to the following dimensions: * _Accuracy:_ Accuracy can be assessed through the impact of key survey design features (e.g., sampling procedure, mode) on the TSE.
For this purpose, our coding scheme includes variables to capture detailed information about the survey design used. We included the codes on which decisions were taken by the data producers
regarding various survey design characteristics frequently discussed in textbooks on survey design13,22,23 and survey data reporting guidelines such as the AAPOR standards24. *
_Interpretability:_ Interpretability refers to whether information about the survey design is available. A code capturing the presence of this information is provided for most variables in
the dataset. Interpretability can be assessed by comparing these codes with the social science survey reporting standards (e.g., AAPOR standards24), guidelines for high-quality documentation
of survey data25, and previous approaches to quality assessments of data documentation26. * _Accessibility:_ Accessibility can be assessed based on whether and when the survey data and the
first results were made available to users. For this purpose, our coding scheme includes variables and codes on whether and when data and results were published. Our coding scheme includes
121 variables that had to be coded for each survey. These codes are listed in our codebook. CODING PROCEDURE The coding of data was performed between November 2022 and the end of May 2023 by
two expert coders with a background in social science data collection methods. During the coding stages, interrater reliability was tested with randomly selected subsets of surveys (see
Technical Validation). After each reliability test, the coders held a workshop and discussed discrepancies and decided together about cases in doubt. During the workshops, they also refined
the coding scheme to remedy any shortcomings. DATA RECORDS The SDCCP data are publicly available as a dataset in Stata format (.dta) and in CSV format (.csv) at the GESIS Data Archive for
the Social Sciences27. The data download includes the dataset and the supporting documentation (e.g., coding scheme). The dataset covers a total of 717 surveys conducted as part of 183
survey programs. For each survey, a total of 121 variables were coded. The SDCCP data are arranged in tabular format. Each row represents one survey, whereas each column represents one
variable of the dataset (e.g., id, field period). Survey programs that fielded multiple waves or surveys during our observation period are represented as multiple rows in the dataset. The
variables included in our dataset can be differentiated into three categories—technical variables, basic information, and quality variables: * _Technical variables_: Technical variables
enable the identification of the coders and the coded surveys. Multiple variables related to the survey ID enable analysis at various levels (e.g., a survey program ID for the most
aggregated level and a wave-specific survey ID for a more detailed distinction). * _Basic information_: Variables in this group provide information on the survey title, topic, its initiator,
conductor, and funding. * _Quality variables_: Quality variables cover various survey design features used in the above-described assessment of survey data quality (e.g., mode, sampling,
sample size, availability of information and data). Table 1 provides an overview of the coded characteristics by category. Detailed information on the variables can be found in the codebook
provided as part of the dataset documentation in the GESIS Data Archive for the Social Sciences. Figure 2 shows the number of surveys by their month of fieldwork start. The comparatively
high number in the first months illustrates the high demand for survey data, especially at the beginning of the COVID-19 pandemic. TECHNICAL VALIDATION At two points during the coding
process, we conducted an assessment of _interrater reliability_, which is a numerical measure of the agreement between coders as to how to code the same data. High values indicate that the
coding scheme is well specified and that most people would make the same coding decisions28. However, high agreement between coders also can result from chance alone. Therefore, various
coefficients and indicators have been proposed that differ in their approaches to accounting for the chance in agreement29,30,31. Based on the scale and empirical distribution of the
variables in our coding scheme, we decided which coefficient and indicator to report. For assessing interrater agreement for nominally scaled items, we chose to apply Brennan and
Prediger’s32 coefficient because these variables of our coding scheme were frequently found to have a highly uneven marginal distribution (i.e., ratings fall much more frequently under one
category than the other). For several coefficients, including Cohen’s kappa and Krippendorff’s alpha, highly skewed distributions lead to reliability estimates that are counterintuitively
low in the face of a high observed agreement, also known as the “prevalence problem”30 or “high agreement, but low reliability paradox”29. In contrast, Brennan and Prediger’s coefficient is
not affected this way, since its concept of chance agreement is based on the assumption that if coders operated only by chance, a uniform distribution would arise, and, accordingly, merely
considers the number of possible categories31,33. Brennan and Prediger’s coefficient is equivalent to the prevalence-adjusted and bias-adjusted kappa proposed by Byrt _et al_.34, also known
as PABAK31, and Bennett _et al_.’s S coefficient29,35. To assess the interrater agreement with regard to the continuous scaled items, we calculated the intra-class correlation (ICC), a
two-way model assessing absolute agreement30. Both coefficients were obtained using the Stata package KAPPAETC31. For our interrater reliability analyses, a random 10% sample from all survey
programs was double-coded (N = 20). For multi-wave survey programs, we only double-coded the first wave that was part of the dataset. We performed double coding in two rounds: once at the
very beginning (N = 10) and once in the middle of the coding process (N = 10). This approach enabled us to discuss discrepancies and clarify the causes of conflicting interpretations among
coders early in the coding process28. We calculated all reliability coefficients once for the whole sample (N = 20), as well as separately for each assessment round. The latter approach
enabled us to detect the impact of the clarification process after the first round on subsequent coding. As a summary indicator across all variables, we calculated the respective average of
all single-item coefficients. Note that not all variables could be included in the analysis. In addition to string variables and technical variables, we excluded variables that were rarely
coded due to filtering and had too few values (e.g., type and timing of applied incentives, timing of survey data releases). The variables that were included in the analyses, as well as the
respective calculated coefficients, are listed in Table 2 (categorial variables) and Table 3 (continuous variables). Looking at Brennan and Prediger’s coefficient (Table 2), our analysis
yielded an in-total average value of 0.87 (round 1: 0.85; round 2: 0.90). With respect to the ICC (Table 3), our analysis resulted in an in-total average value of 0.99 (round 1: 0.99; round
2: 0.94). All of these values indicate an excellent overall interrater reliability for both (considered) categorical variables and (considered) continuous variables30,36,37. USAGE NOTES When
working with the SDCCP dataset, we would like to highlight several points that data users should consider with respect to the structure, potential limitations, and linkage possibilities of
our dataset. First, individual cases (i.e., rows) are not necessarily independent of each other. Individual surveys or panel waves belong to larger survey contexts (e.g., survey programs).
To enable data users to work with this clustered data structure, we included a set of ID variables (v2 - v5; see codebook). At the highest level, these variables enable a distinction between
survey programs (v2), some of which consist of several sub-programs (v3). Again, each sub-program may consist of one or more surveys or waves (v4). Finally, for some surveys, several
samples of a survey had to be recorded in separate rows (v5) if they differed in their survey design, and therefore, could not be coded together in a single row. Similarly, for some survey
programs that included multiple surveys, only aggregated information that spanned multiple waves (e.g., total number of cases) was available. When we were unable to disentangle this
information, we included such survey programs as a single row in the data set, and we added a technical variable (v6) indicating how many surveys or waves this entry technically covered. The
decision to still include these cases was made to ensure the completeness of our records and to include as many eligible surveys as possible. As needed for their respective analyses, we
recommend that data users utilize the information provided to account for the clustered structure of the SDCCP dataset. Second, in our efforts to collect data about social science surveys
conducted during the COVID-19 pandemic, we focused on surveys in Germany. This decision was made to offer in-depth insights in survey data collection practices during a time of crises within
a similar context. Keeping the context (e.g., national legislation, funding opportunities) the same, enhanced the comparability between the surveys we included in our data. Focusing on
Germany further enabled us to gather data to comprehensively study the data collection practices in an economically and politically important European country. Having said that, we are aware
that the focus on Germany might impair the generalizability of our findings to surveys carried out in other countries. Therefore, we encourage similar research projects in other countries
or even cross-nationally. Our research design, selection criteria, and coding scheme could serve as blueprints for such research. However, based on our own experience, we would caution
researchers about the extent of the necessary personal resources for such an endeavor, and recommend they obtain appropriate funding. Third, to select the surveys to be included in the SDCCP
dataset, we developed and pursued a systematic approach. Thus, we relied on surveys that were searched for in the major German data archive for the social sciences, internationally renowned
repositories in the same field, and the comprehensive RatSWD list, which we heavily relied on. This approach ensured that at least some publicly obtainable information was available to
determine the eligibility of cases for inclusion in our dataset. To extend this list and include surveys that were not included in these lists and repositories, we conducted a web search
that followed a snowballing method based on our earlier records. While we are confident that our method enabled us to include a major part of our target population, we would caution that not
every survey is included in our dataset. We assume that especially smaller surveys that were conducted but did not publish their data for reuse or published them on private outlets are
underrepresented in the data. Therefore, we recommend that data users interpret their findings accordingly and remember that smaller, less-well documented, and unpublished datasets likely
are underrepresented in the SDCCP dataset. Four, the SDCCP dataset can be linked with individual level survey data by using the technical variables on survey title and/or survey wave (in the
case of panel surveys). Enriching existing datasets with SDCCP data can be useful when working with multiple survey datasets. In this case, survey design characteristics and our quality
assessment can be considered in the analyses, for example, to control for the impacts of survey designs. For this purpose, design-based information that was coded as part of SDCCP can be
utilized as a supplement. Fifth, furthermore, the SDCCP dataset can be supplemented with data on the events that occurred during the COVID-19 pandemic. This information can provide
additional context when working with the SDCCP dataset. Figure 3 shows an example based on the data obtained from the Oxford COVID-19 Government Response Tracker38. For illustrative
purposes, we plotted how the seven-day average of new COVID cases and an index of the stringency of lockdown policy developed between 2020 and 2022 in Germany. Information on the pandemic
can be linked with the SDCCP dataset using the variables on the time of fieldwork. CODE AVAILABILITY The code and data files that we used to assess interrater reliability (see section
Technical Validation) are available at the GESIS Data Archive for the Social Sciences39. REFERENCES * Bavel, J. J. V. _et al_. Using social and behavioural science to support Covid-19
pandemic response. _Nat. Hum. Behav._ 4, 460–471 (2020). Article PubMed Google Scholar * Yamada, Y. _et al_. COVIDiSTRESS Global survey dataset on psychological and behavioural
consequences of the Covid-19 outbreak. _Sci. Data_ 8, 3 (2021). Article CAS PubMed PubMed Central Google Scholar * Blom, A. G. _et al_. High frequency and high quality survey data
collection: The Mannheim Corona Study. _Surv. Res. Methods_ 14, 171–178 (2020). Google Scholar * Kühne, S., Kroh, M., Liebig, S. & Zinn, S. The need for household panel surveys in times
of crisis: The case of SOEP-CoV. _Surv. Res. Methods_ 195–203, https://doi.org/10.18148/SRM/2020.V14I2.7748 (2020). * Kapteyn, A. _et al_. Tracking the effect of the Covid-19 pandemic on
the lives of American households. _Surv. Res. Methods_ 14, 179–186 (2020). Google Scholar * Kohler, U. Survey research methods during the Covid-19 crisis. _Surv. Res. Methods_ 14, 93–94
(2020). Google Scholar * Cheng, C. _et al_. Capturing the Covid-19 crisis through public health and social measures data science. _Sci. Data_ 9, 520 (2022). Article PubMed PubMed Central
Google Scholar * Gummer, T. _et al_. The impact of Covid-19 on fieldwork efforts and planning in pairfam and FReDA-GGS. _Surv. Res. Methods_ 14, 223–227 (2020). Google Scholar * Sastry,
N., McGonagle, K. & Fomby, P. Effects of the Covid-19 crisis on survey fieldwork: Experience and lessons from two major supplements to the U.S. Panel Study of Income Dynamics. _Surv.
Res. Methods_ 14, 241–245 (2020). PubMed PubMed Central Google Scholar * Burton, J., Lynn, P. & Benzeval, M. How Understanding Society: The UK Household Longitudinal Study adapted to
the Covid-19 pandemic. _Surv. Res. Methods_ 14, 235–239 (2020). Google Scholar * RatSWD. Studien zur Corona-Pandemie. _KonsortSWD_ https://www.konsortswd.de/themen/krisen/corona/ (2023). *
Dillman, D. A., Smyth, J. D. & Christian, L. M. _Internet, Phone, Mail, And Mixed-Mode Surveys: The Tailored Design Method_. (John Wiley & Sons, 2014). * Groves, R. M. _et al_.
_Survey Methodology_. (John Wiley & Sons, Hoboken, New Jersey, 2009). * Post, J., Class, F. & Kohler, U. Unit nonresponse biases in estimates of SARS-CoV-2 prevalence. _Surv. Res.
Methods_ 14, 115–121 (2020). Google Scholar * Schaurer, I. & Weiß, B. Investigating selection bias of online surveys on coronavirus-related behavioral outcomes. _Surv. Res. Methods_ 14,
103–108 (2020). Google Scholar * Hipp, L., Bünning, M., Munnes, S. & Sauermann, A. Problems and pitfalls of retrospective survey questions in COVID-19 studies. _Surv. Res. Methods_ 14,
109–1145 (2020). Google Scholar * Page, M. J. _et al_. The PRISMA 2020 statement: an updated guideline for reporting systematic reviews. _BMJ_ 372, n71 (2021). Article PubMed PubMed
Central Google Scholar * Lyberg, L. E. & Weisberg, H. F. Total survey error: a paradigm for survey methodology. in _The SAGE Handbook of Survey Methodology_ 27–40 (2016). * Groves, R.
M. & Lyberg, L. Total survey error: past, present, and future. _Public Opin. Q._ 74, 849–879 (2010). Article Google Scholar * Biemer, P. P. Total survey error: design, implementation,
and evaluation. _Public Opin. Q._ 74, 817–848 (2010). Article Google Scholar * Wilkinson, M. D. _et al_. The FAIR guiding principles for scientific data management and stewardship. _Sci.
Data_ 3, 160018 (2016). Article PubMed PubMed Central Google Scholar * Wolf, C., Joye, D., Smith, T. W. & Fu, Y. _The SAGE Handbook Of Survey Methodology_. (SAGE, 2016). * Marsden,
P. V. & Wright, J. D. _Handbook Of Survey Research_. (Emerald Group Publ., Bingley, 2010). * The American Association for Public Opinion Research. _Standard Definitions: Final
Dispositions of Case Codes and Outcome Rates for Surveys. 10th Edition_. (2023). * Jedinger, A., Watteler, O. & Förster, A. Improving the quality of survey data documentation: a total
survey error perspective. _Data_ 3, 45 (2018). Article Google Scholar * Jabkowski, P. & Kołczyńska, M. Sampling and fieldwork practices in Europe: analysis of methodological
documentation from 1,537 surveys in five cross-national projects, 1981–2017. _Methodology_ 16, 186–207 (2020). Article Google Scholar * von Glasenapp, K., Skora, T., Gummer, T. &
Naumann, E. SDCCP 1 - Survey Design and Data Quality During the Covid-19 Pandemic. https://doi.org/10.7802/2652. * O’Connor, C. & Joffe, H. Intercoder reliability in qualitative
research: debates and practical guidelines. _Int. J. Qual. Methods_ 19, 1609406919899220 (2020). Article Google Scholar * Feng, G. C. Intercoder reliability indices: disuse, misuse, and
abuse. _Qual. Quant._ 48, 1803–1815 (2014). Article Google Scholar * Hallgren, K. A. Computing inter-rater reliability for observational data: an overview and tutorial. _Tutor. Quant.
Methods Psychol._ 8, 23–34 (2012). Article PubMed PubMed Central Google Scholar * Klein, D. Implementing a general framework for assessing interrater agreement in Stata. _Stata J._ 18,
871–901 (2018). Article Google Scholar * Brennan, R. L. & Prediger, D. J. Coefficient Kappa: some uses, misuses, and alternatives. _Educ. Psychol. Meas._ 41, 687–699 (1981). Article
Google Scholar * Feng, G. C. Mistakes and how to avoid mistakes in using intercoder reliability indices. _Methodol. Eur. J. Res. Methods Behav. Soc. Sci._ 11, 13–22 (2015). ADS Google
Scholar * Byrt, T., Bishop, J. & Carlin, J. B. Bias, prevalence and Kappa. _J. Clin. Epidemiol._ 46, 423–429 (1993). Article CAS PubMed Google Scholar * Bennett, E. M., Alpert, R.
& Goldstein, A. C. Communications through limited-response questioning. _Public Opin. Q._ 18, 303–308 (1954). Article Google Scholar * Landis, J. R. & Koch, G. G. The measurement
of observer agreement for categorical data. _Biometrics_ 33, 159 (1977). Article CAS PubMed Google Scholar * Cicchetti, D. Guidelines, criteria, and rules of thumb for evaluating normed
and standardized assessment instrument in psychology. _Psychol. Assess._ 6, 284–290 (1994). Article Google Scholar * Hale, T. _et al_. A global panel database of pandemic policies (Oxford
COVID-19 Government Response Tracker). _Nat. Hum. Behav._ 5, 529–538 (2021). Article PubMed Google Scholar * Skora, T. & von Glasenapp, K. Stata code for assessing interrater
reliability in the coding of the SDCCP 1 dataset. https://doi.org/10.7802/2656. Download references ACKNOWLEDGEMENTS This work was funded by the German Federal Ministry of Education and
Research (BMBF) as part of the SDCCP project (grant number 01UP2100). FUNDING Open Access funding enabled and organized by Projekt DEAL. AUTHOR INFORMATION AUTHORS AND AFFILIATIONS * GESIS –
Leibniz Institute for the Social Sciences, Mannheim, Germany Tobias Gummer, Thomas Skora, Karolina von Glasenapp & Elias Naumann * University of Mannheim, School of Social Sciences,
Mannheim, Germany Tobias Gummer Authors * Tobias Gummer View author publications You can also search for this author inPubMed Google Scholar * Thomas Skora View author publications You can
also search for this author inPubMed Google Scholar * Karolina von Glasenapp View author publications You can also search for this author inPubMed Google Scholar * Elias Naumann View author
publications You can also search for this author inPubMed Google Scholar CONTRIBUTIONS T.G. conceived the overall project, developed the research design, and acquired funding. All authors
conceptualized the sampling procedure. T.G., K.v.G., and T.S. developed the coding scheme based on a literature review. T.S. and K.v.G. collected and coded all the data. T.S. conducted the
reliability analyses. T.G. and E.N. advised on the data analyses and data collection. T.G., T.S. and K.v.G. drafted the manuscript. T.G. and E.N. substantively revised the manuscript. All
authors reviewed the final draft. CORRESPONDING AUTHOR Correspondence to Tobias Gummer. ETHICS DECLARATIONS COMPETING INTERESTS The authors declare no competing interests. ADDITIONAL
INFORMATION PUBLISHER’S NOTE Springer Nature remains neutral with regard to jurisdictional claims in published maps and institutional affiliations. RIGHTS AND PERMISSIONS OPEN ACCESS This
article is licensed under a Creative Commons Attribution 4.0 International License, which permits use, sharing, adaptation, distribution and reproduction in any medium or format, as long as
you give appropriate credit to the original author(s) and the source, provide a link to the Creative Commons licence, and indicate if changes were made. The images or other third party
material in this article are included in the article’s Creative Commons licence, unless indicated otherwise in a credit line to the material. If material is not included in the article’s
Creative Commons licence and your intended use is not permitted by statutory regulation or exceeds the permitted use, you will need to obtain permission directly from the copyright holder.
To view a copy of this licence, visit http://creativecommons.org/licenses/by/4.0/. Reprints and permissions ABOUT THIS ARTICLE CITE THIS ARTICLE Gummer, T., Skora, T., von Glasenapp, K. _et
al._ A dataset on survey designs and quality of social and behavioral science surveys during the COVID-19 pandemic. _Sci Data_ 11, 619 (2024). https://doi.org/10.1038/s41597-024-03475-x
Download citation * Received: 25 December 2023 * Accepted: 04 June 2024 * Published: 12 June 2024 * DOI: https://doi.org/10.1038/s41597-024-03475-x SHARE THIS ARTICLE Anyone you share the
following link with will be able to read this content: Get shareable link Sorry, a shareable link is not currently available for this article. Copy to clipboard Provided by the Springer
Nature SharedIt content-sharing initiative