Structure of a mammalian sperm cation channel complex
- Select a language for the TTS:
- UK English Female
- UK English Male
- US English Female
- US English Male
- Australian Female
- Australian Male
- Language selected: (auto detect) - EN
Play all audios:
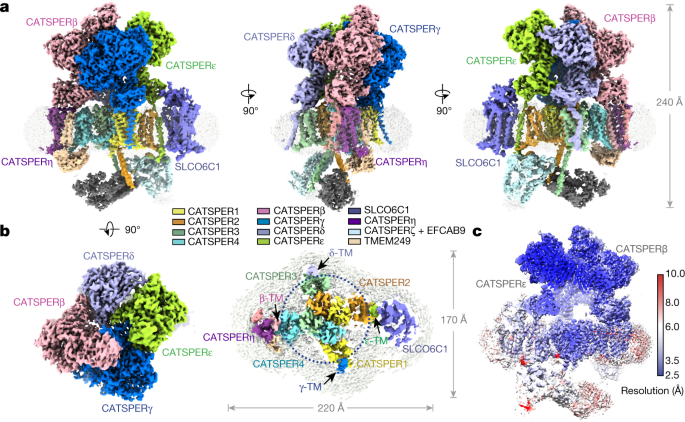
The cation channel of sperm (CatSper) is essential for sperm motility and fertility1,2. CatSper comprises the pore-forming proteins CATSPER1–4 and multiple auxiliary subunits, including
CATSPERβ, γ, δ, ε, ζ, and EFCAB91,3,4,5,6,7,8,9. Here we report the cryo-electron microscopy (cryo-EM) structure of the CatSper complex isolated from mouse sperm. In the extracellular view,
CATSPER1–4 conform to the conventional domain-swapped voltage-gated ion channel fold10, following a counterclockwise arrangement. The auxiliary subunits CATSPERβ, γ, δ and ε—each of which
contains a single transmembrane segment and a large extracellular domain—constitute a pavilion-like structure that stabilizes the entire complex through interactions with CATSPER4, 1, 3 and
2, respectively. Our EM map reveals several previously uncharacterized components, exemplified by the organic anion transporter SLCO6C1. We name this channel–transporter ultracomplex the
CatSpermasome. The assembly and organization details of the CatSpermasome presented here lay the foundation for the development of CatSpermasome-related treatments for male infertility and
non-hormonal contraceptives.
The cryo-EM maps of the mouse CatSpermasome and the corresponding atomic coordinate have been deposited in the Electron Microscopy Data Bank and the Protein Data Bank under the accession
codes EMD-31076 and 7EEB, respectively. The mass spectrometry data have been deposited in the MassIVE database (https://massive.ucsd.edu/ProteoSAFe/static/massive.jsp) under the accession
number MSV0000987325. All data analysed during this study are included in this Article and its Supplementary Information. Any other relevant data are available from the corresponding author
upon reasonable request.
We thank N. Yan and H. Yu for critical reading of the manuscript; M. Jiang and Y. Ru for help with the immunofluorescence experiments; the Cryo-EM Facility and HPC Center of Westlake
University for providing cryo-EM and computation support; S. Feng and the Mass Spectrometry & Metabolomics Core Facility of Westlake University for protein sample MS analysis; and J. Bao, D.
Wu and the Laboratory Animal Resources Center of Westlake University for help with animal maintenance and IVF experiments. This work was supported by Westlake Laboratory (Westlake
Laboratory of Life Sciences and Biomedicine) (W101486022101) and an Institutional Startup Grant from the Westlake Education Foundation (101486021901) to J.W.
Key Laboratory of Structural Biology of Zhejiang Province, School of Life Sciences, Westlake University, Hangzhou, China
Westlake Laboratory of Life Sciences and Biomedicine, Hangzhou, China
Institute of Biology, Westlake Institute for Advanced Study, Hangzhou, China
J.W. conceived and supervised the project; S.L. and Y.Z. prepared the protein sample under the guidance of Z.Y. and J.W.; S.L. collected the cryo-EM data and M.K. calculated the cryo-EM map;
J.W. built the model; all authors contributed to data analysis; and J.W. wrote the manuscript.
Peer review information Nature thanks the anonymous reviewers for their contribution to the peer review of this work.
Publisher’s note Springer Nature remains neutral with regard to jurisdictional claims in published maps and institutional affiliations.
a, The genotype of each mouse was verified by two PCR reactions. Top, schematic of the genotyping procedure. Bottom, a group of representative PCR results. NC, negative control (empty
template); WT, wild type; KI/+, heterozygote knock-in; KI/KI, homozygote knock-in. In total, 49 wild-type, 676 KI/+, and 207 KI/KI mice were verified. b, An drawing of a mouse sperm. CatSper
was mainly distributed at the principal piece of spermatozoa. c, EGFP fluorescence was detected in the principal piece (red arrows) of knock-in mouse spermatozoa, but not wild-type mouse
spermatozoa. Blue arrows, auto-fluorescence signal observed in the middle piece of spermatozoa. Shown here are one of the two images taken for each sample. Scale bars, 30 μm. d, Schematic of
CatSpermasome purification. e, The purified protein sample was subjected to gel filtration analysis. The peak fractions of CatSpermasome (arrow) were collected and concentrated for cryo-EM
and MS studies. Inset, the cross-linked protein sample was visualized on SDS–PAGE by silver staining. The corresponding protein band (arrow) in a separate gel without staining was cut out
for MS analysis. For gel source data, see Supplementary Fig. 1. f, A representative EM micrograph of the CatSpermasome sample stained with uranyl acetate (one micrograph out of five in total
for the negative staining sample). Scale bar, 50 nm.
a, MS samples were the same as used for the cryo-EM study. MS detected proteins are shown in order of decreasing confidence. All previously characterized CatSper components are listed
(yellow). The top six entries with highest peptide spectrum match (PSM) values are all CATSPER proteins. Most of the contaminating proteins are cytoskeletal proteins. The newly identified
components SLCO6C1 and CATSPERη are highlighted in red. TMEM249, which is probably another new component, is shaded in light blue. b, Representative MS spectra for specific peptides of
CATSPER1, SLCO6C1, CATSPERη, and TMEM249.
a, A representative motion-corrected micrograph of the CatSpermasome cryo-EM sample out of a dataset of 16,648 images. Scale bar, 50 nm. b, Two-dimensional class averages. Box size, 430 Å.
c, Gold standard FSC curves for the 3D reconstructions. The curves were calculated with masks for the entire protein (overall map), and for masked regions of corresponding maps. See f for
each map. d, Validation of the final structure models. FSC curves of the final refined model versus the summed map that it was refined against (black); of the model versus the first half-map
(blue); and of the model versus the second half-map (red). The small difference between the blue and red curves indicates that the refinement of the atomic coordinates did not suffer from
overfitting. e, Angular distribution of the particles of the final reconstruction generated by cryoSPARC. f, Flowchart of EM data processing (see ‘Image processing’ in Methods).
a, The cytosolic region consists of two separate but interacting parts. Cytosolic map 1 is in close contact with the S6 segments of CATSPER2 and CATSPER3. A density surrounded in the bottom
of cytosolic map 1 (shown in green) is connected to the density of the S6 segment of CATSPER3 and may belong to the carboxyl end of CATSPER3. Owing to limited resolution, the identity of
cytosolic map 1 remains to be determined. Cytosolic map 2, however, is likely to be the subcomplex of EFCAB9 and CATSPERζ. The maps were generated in ChimeraX. b, Predicted structures of
EFCAB9 by tFold and CATSPERζ by trRosseta. EFCAB9 has two EF-hand motif-containing lobes, which is very similar to calmodulin. CATSPERζ consists mainly of α-helices. c, Docking of the
predicted structures of EFCAB9 and CATSPERζ into cytosolic map 2. The two lobes of EFCAB9 are in a compact conformation instead of the extended conformation in the predicted structure. The
main body of CATSPERζ (light cyan in b) can be fitted into the remaining density near EFCAB9 in cytosolic map 2. Several fitted α-helices are indicated by arrows.
a, Electron density maps of each segment of the transmembrane helices of CATSPER1–4. The boundaries of each displayed segment are labelled. The densities, shown as blue meshes, are contoured
at 3–4σ in PyMOL. b, Electron density map of the selectivity filter and the pore helices. The densities are contoured at 4σ. Two tentatively assigned Na+ ions are shown as purple spheres.
c, Electron density maps of detergent-like molecules. These densities may also belong to cholesterol or steroid hormones under physiological conditions. Three GDN molecules are tentatively
assigned to these densities. The densities are found in a semi-open cavity formed by the S3, S4 and S4–5 segments of CATSPER1, but not CATSPER2–4, whose corresponding cavities are smaller.
d, Structural superimposition of CATSPER1–4 indicates that CATSPER1 has a larger cavity for binding of detergent-like molecules.
a, Overall structure of the pore domain of CATSPER1–4. The critical DDDD residues in the selectivity filter are shown as sticks. Each S6 segment contains a π-helix turn (red arrows). b,
Sequence alignment of the selectivity filter and the pore helices among mouse CATSPER1–4, human CATSPER1–4, and rabbit Cav1.1. The invariant Thr and Trp residues are shaded cyan. The DDDD
residues in the selectivity filter of CATSPER1–4 and the corresponding residues EEEE in Cav1.1 are highlighted red. c, Sequence alignment of the VSDs among CATSPER1–4. The boundary of each
segment is shaded light grey. Positively charged residues on S4 segments are shaded blue and residues corresponding to positions R1–R6 are boxed. An1 and CTC residues on segments S2 and S3
are shaded purple. d, Structural comparison of the VSDs among CATSPER1–4. The four VSDs are superimposed relative to CTC and An1 on S2. For visual clarity, the S1 segments are omitted and
only the side chains of aligned residues and R4 residues on the S4 segments are shown.
a, The overall structures of CATSPERβ, γ, δ and ε share similar domain organizations. The structures are shown in cartoon form and the sugar moieties in the glycosylation sites are shown as
sticks. The NTDs, β-propeller domains, Ig-like domains, stem domains and transmembrane domains are coloured green, blue, orange, yellow and salmon, respectively. The head domain in CATSPERβ
and the NTD2 domain in CATSPERε are coloured slate and cyan, respectively. b, Domain organization of CATSPERβ, γ, δ and ε. The boundaries for each domain and the identified glycosylation
sites are labelled. The disulfide bonds are indicated by orange lines. See Extended Data Table 2 for details. c, Inter-subunit interactions among CATSPERβ, γ, δ and ε, shown in four side
views. CATSPERβ is domain coloured and CATSPERγ, δ and ε are coloured as in Fig. 1. The side openings formed by two adjacent subunits are indicated by dotted lines. For visual clarity, the
transmembrane helices are omitted. d, Extracellular view of the auxiliary subunits. The top of the channel is sealed by the Ig-like domains of CATSPERβ, γ, δ and ε. Bottom, close-up view of
the interactions among the Ig-like domains (box in top image). The residues that mediate the interactions in the interface are shown as sticks. Hydrogen bonds are indicated by red dashed
lines. e, Interactions between the transmembrane domains of CATSPERβ, γ, δ and ε and the adjacent VSDs of CATSPER1–4. The residues that contribute to the interface interactions are shown as
sticks. Potential hydrogen bonds are indicated by red dashed lines. The stem domains of CATSPERβ and CATSPERε are further from the adjacent channel subunits than those of CATSPERγ and
CATSPERδ (double-headed arrows).
The selected segments cover almost every domain of CATSPERβ, γ, δ and ε. Representative densities for the glycosylation sites from each subunit are also presented. The densities, shown as
blue meshes, are contoured at 4–5σ in PyMOL.
a, Side view (left) and central slice view (right) of the electron density map of SLCO6C1 and the adjacent components. The map was generated in ChimeraX. b, SLCO6C1 is captured in an
outward-facing conformation. The structure is shown in cylindrical helices cartoon mode and coloured by domain. Right, the N and C domains of SLCO6C1 each contain six transmembrane helices
and are pseudo-symmetric, with an r.m.s.d. of ~6 Å when superimposed. c, Sequence alignment among mouse SLCO6C1, rat SLCO6C1 and human SLCO6A1. The glycosylation site (red triangle) and the
residues that may be involved in interactions with CATSPERε (yellow triangles) are conserved among species. The uniport IDs for the aligned sequences are: mSLCO6C1: Q3V161; rSLCO6C1: G3V7R7;
and hSLCO6A1: Q86UG4.
a, Side view (left) and central slice view (right) of the electron density maps of CATSPERη and the adjacent components. The map was generated in ChimeraX. b, Electron density maps of
CATSPERη. The map allows accurate assignment of the side chains of the bulky residues. The densities, shown as blue meshes, are contoured at 4σ in PyMOL. c, Predicted structure of TMEM249 by
tFold perfectly fits into the density near CATSPERη with minor adjustments. The structure has the characteristics of two transmembrane helices and a β-sheet (arrows) in the cytosolic
domain. d, TMEM249 interacts with CATSPERη and VSD4 in the transmembrane and cytosolic regions, respectively. Unlike CATSPERη, TMEM249 does not interact with the stem domain of CATSPERβ.
CATSPER1, CATSPER4, CATSPERβ and TMEM249 are mainly distributed in the principal piece of sperm (red fluorescence signal). The sperm head, middle piece and principal piece are indicated by
black, blue, and red arrows, respectively. NC, negative control (without primary antibody). Shown here are one of three images taken for each sample. Scale bars, 20 μm.
Uncropped raw data gel from Extended Data Fig. 1 - SDS-PAGE gel for Extended Data Fig. 1e showing the BS3-crosslinked purified mouse CatSpermasome sample by silver staining.
: Overall EM map of the mouse CatSpermasome The displayed overall composite map was in the same color scheme as Fig. 1. The movie was generated in ChimeraX
Anyone you share the following link with will be able to read this content: