Inducing and exploiting vulnerabilities for the treatment of liver cancer
- Select a language for the TTS:
- UK English Female
- UK English Male
- US English Female
- US English Male
- Australian Female
- Australian Male
- Language selected: (auto detect) - EN
Play all audios:
Liver cancer remains difficult to treat, owing to a paucity of drugs that target critical dependencies1,2; broad-spectrum kinase inhibitors such as sorafenib provide only a modest benefit to
patients with hepatocellular carcinoma3. The induction of senescence may represent a strategy for the treatment of cancer, especially when combined with a second drug that selectively
eliminates senescent cancer cells (senolysis)4,5. Here, using a kinome-focused genetic screen, we show that pharmacological inhibition of the DNA-replication kinase CDC7 induces senescence
selectively in liver cancer cells with mutations in TP53. A follow-up chemical screen identified the antidepressant sertraline as an agent that kills hepatocellular carcinoma cells that have
been rendered senescent by inhibition of CDC7. Sertraline suppressed mTOR signalling, and selective drugs that target this pathway were highly effective in causing the apoptotic cell death
of hepatocellular carcinoma cells treated with a CDC7 inhibitor. The feedback reactivation of mTOR signalling after its inhibition6 is blocked in cells that have been treated with a CDC7
inhibitor, which leads to the sustained inhibition of mTOR and cell death. Using multiple in vivo mouse models of liver cancer, we show that treatment with combined inhibition of of CDC7 and
mTOR results in a marked reduction of tumour growth. Our data indicate that exploiting an induced vulnerability could be an effective treatment for liver cancer.
Raw and processed data from the next-generation RNA sequencing of samples have been deposited in the NCBI Gene Expression Omnibus (GEO) under accession number GSE121276 and GSE121277. All
other data can be found in the Source Data, Supplementary Information or are available from the corresponding authors upon reasonable request.
We thank L. Zender, R. Smits, X. Qiao and L. Li for the kind gift of cell lines. This work was funded by grants from the European Research Council (ERC 787925 to R.B.), the Dutch Cancer
Society (KWF 12049/2018-2 to L.A., 6702/2014 to B.B. and H.t.R) through the Oncode Institute and the Center for Cancer Genomics (CGC: http://cancergenomics.nl), the National Basic Research
Program of China (973 Program: 2015CB553905), the National Key Sci-Tech Special Projects of Infectious Diseases of China (2018ZX10732202-002-003), the National Natural Science Foundation of
China (81920108025, 81421001, 81672933, and 81874229), Shanghai Municipal Education Commission-Gaofeng Clinical Medicine Grant Support (20181703), Shanghai Municipal Commission of Health and
Family Planning (2017YQ064 and 2018YQ20) and Shanghai Rising-Star Program (18QA1403900). We thank the facilities of Netherlands Cancer Institute: Animal Laboratory, Mouse Clinic Imaging
Unit, Experimental Animal Pathology, Flow Cytometry, Sequencing and BioImaging.
These authors contributed equally: Cun Wang, Serena Vegna, Haojie Jin, Bente Benedict
State Key Laboratory of Oncogenes and Related Genes, Shanghai Cancer Institute, Renji Hospital, Shanghai Jiao Tong University School of Medicine, Shanghai, China
Oncode Institute, Division of Molecular Carcinogenesis, The Netherlands Cancer Institute, Amsterdam, The Netherlands
Cun Wang, Haojie Jin, Cor Lieftink, Rodrigo Leite de Oliveira, Ben Morris, Aimée du Chatinier, Liqin Wang, Bastiaan Evers, Zheng Xue, Arnout Schepers, Fleur Jochems, Antonio Mulero Sanchez,
Sara Mainardi, Roderick L. Beijersbergen & René Bernards
Oncode Institute, Division of Tumour Biology and Immunology, The Netherlands Cancer Institute, Amsterdam, The Netherlands
Serena Vegna, Bente Benedict, Christel Ramirez, Jules Gadiot, Hein te Riele & Leila Akkari
Division of Cell Biology, The Netherlands Cancer Institute, Amsterdam, The Netherlands
Liver Cancer Institute, Zhongshan Hospital, Fudan University, Key Laboratory of Carcinogenesis and Cancer Invasion, Ministry of Education, Shanghai, China
Department of Pathology, Eastern Hepatobiliary Surgery Hospital, Second Military Medical University, Shanghai, China
C.W. and R.B. conceived the idea and designed the study. R.B., L.A., W.Q. and R.L.B. supervised all research. R.B., L.A., C.W. and S.V. wrote the manuscript and prepared the figures. C.W.
designed, performed and analysed in vitro experiments and interpreted the results of the xenograft model. S.V. designed, performed and analysed in vivo data conducted on the immunocompetent
mouse models with technical support from J.G. H.J. and D.G. performed xenograft experiments. B.B. designed, performed and analysed neutral comet assays. C.L. and B.E. performed data
analysis. C.R. performed quantification analyses of in vivo staining. B.M. performed the GPCR-compound screen. W.W. performed immunofluorescence. A.d.C. and A.M.S. performed and analysed
SHP2 experiments. G.J. provided clinical samples. R.L.d.O., L.W., Z.X., A.S., F.J., S.M. and H.t.R. provided advice for the project. All authors commented on the manuscript.
C.W. and R.B. are listed as inventors of a patent application using the one–two punch therapy (CDC7 inhibitor and mTOR inhibitor) for liver cancers with TP53 mutations. R.B. is the founder
of the company Oncosence, which exploits pro-senescence therapies for cancer.
Publisher’s note Springer Nature remains neutral with regard to jurisdictional claims in published maps and institutional affiliations.
Peer review information Nature thanks Hisao Masai and the other, anonymous, reviewer(s) for their contribution to the peer review of this work.
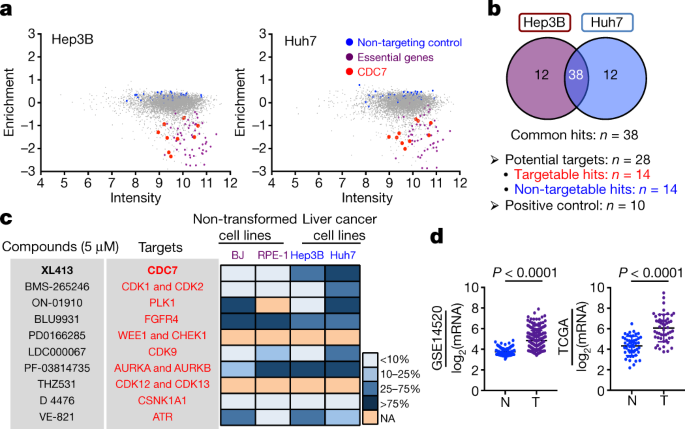
a, Thirty-eight common hits (among the top-50 most-strongly depleted hits in each cell line) were identified by CRISPR screen in Hep3B and Huh7 cells. Hits in red represent factors that are
targetable with small-molecule compounds. Blue represents non-targetable hits. b, Western blot analysis of levels of CDC7, MCM2 and phosphorylated MCM2 in non-transformed cell lines and
liver cancer cell lines. HSP90 served as a loading control. c, Immunohistochemical analysis showing increased expression of CDC7 in HCC tissues, compared to paired adjacent non-tumour
tissues. d, According to the level of CDC7 mRNA obtained from the TCGA database (n = 365 patients), patients with HCC were classified into 3 groups: the top 33.3% were considered as
high-expression, the medium 33.3% were considered as intermediate-expression and the lowest 33.3% were considered as low-expression. Kaplan–Meier curves depicting that upregulation of CDC7
mRNA correlates with poor prognosis of patients with HCC. Statistical significance was calculated using a two-sided log-rank test. e, Liver cancer cell lines with wild-type TP53 (SK-Hep1 and
Huh6) were stably transduced with control pLKO vector or with one of three independent shRNAs that target TP53 (labelled here as shp53 #1, #2 and #3). On the basis of knockdown efficiency,
TP53 shRNA no. 1 and TP53 shRNA no. 3 were selected for further experiments. f, SK-Hep1 and Huh6 cells that express a control shRNA (pLKO) or knockdown of TP53 (shp53) were exposed to the
indicated concentrations of XL413 in colony-formation assays. Cells were fixed, stained and photographed after 10–14 days of culture. g, SK-Hep1 and Huh6 cells expressing control shRNA or
shRNA against TP53 were exposed to the indicated concentrations of XL413 for five days. CellTiter-Blue viability assays revealed that TP53 knockdown synergizes with treatment with XL413 in
SK-Hep1 and Huh6 cells. Graphs represent mean ± s.d. from six technical replicates. For gel source images, see Supplementary Fig. 1. Data in a, b, e–g are representative of three independent
biological experiments. Data in c are representative images from immunohistochemical analyses using a tissue microarray containing 80 specimens of HCC.
a, Liver cancer cell lines with TP53 mutation were cultured in the presence of 10 μM XL413 for 4 days, which induces senescence (as detected by SA-β-gal staining). b, Growth curves (measured
by Incucyte live-cell analyses) of liver cancer cell lines with TP53 mutations that were either untreated, continuously treated with XL413 or treated with 10 μM of XL413 for 5 or 6 days
before withdrawal of treatment. Graphs represent mean ± s.d. from five technical replicates. c, Representative images of H3K9me3 staining in liver cancer cell lines with TP53 mutations,
exposed to 10 μM XL413 for 7 days. d, Treatment with XL413 induces a senescence-associated secretory phenotype (SASP) in Hep3B and Huh7 cells treated with 10 μM XL413 for 7 days. mRNA
expression of genes associated with the senescence-associated secretory phenotype was determined by qRT–PCR analysis. Graphs represent mean ± s.d. from four technical replicates. e, Liver
cancer cells were cultured in the presence of 10 μM XL413 for 4 days, and apoptotic cells were visualized by caspase-3 and caspase-7 apoptosis assay. Data in a are representative of three
independent biological experiments. Data in b–e are representative of two independent biological experiments.
a, b, Liver cancer cell lines with TP53 mutations (Hep3B, Huh7, SNU398, MHCC97H and HCCLM3) (blue) and liver cancer cell lines with wild-type TP53 (SK-Hep1 and Huh6) (red) were seeded at low
confluence and grown in the absence or presence of the CDC7 inhibitors LY3177833 or TAK-931 at the indicated concentrations, in long-term colony-formation assays. Cells were fixed, stained
and photographed after 10–14 days of culture. c, d, Growth curves (measured by Incucyte live-cell analyses) of liver cancer cell lines with TP53 mutations (Hep3B and Huh7) (blue) and liver
cancer cell lines with wild-type TP53 (SK-Hep1 and Huh6) (red) exposed to LY3177833 or TAK-931. Graphs represent mean ± s.d. from four technical replicates. e, f, Liver cancer cells were
cultured in the presence of the CDC7 inhibitors LY3177833 or TAK-931 at the indicated concentration for 4 days. SA-β-gal staining revealed that CDC7 inhibitors (LY3177833 or TAK-931)
selectively induced senescence in liver cancer cells with TP53 mutations (blue) and not in liver cancer cells with wild-type TP53 (red). g, Liver cancer cell lines with TP53 mutations (Hep3B
and Huh7) and liver cancer cell lines with wild-type TP53 (SK-Hep1 and Huh6) were stably transduced with control pLKO vector or with two independent shRNAs that target CDC7 (labelled here
shCDC7 #1 and #2) and the efficiency of CDC7 knockdown in liver cancer cell lines was evaluated by western blot. h, Colony-formation assays of liver cancer cell lines with TP53 mutation
(blue) and liver cancer-cell lines with wild-type TP53 (red), with and without CDC7 knockdown, were performed. Cells were fixed, stained and photographed after ten days of culture. i, CDC7
knockdown induced senescence in Hep3B and Huh7 cells with TP53 mutations, but not in SK-Hep1 and Huh6 cells, which have wild-type TP53. Senescence was detected by SA-β-gal staining. For gel
source images, see Supplementary Fig. 1. Data in a–i are representative of three independent biological experiments.
a, b, Western blot analysis of liver cancer cell lines treated with CDC7 inhibitors (LY3177833 or TAK-931) for seven days. Inhibition of CDC7 induces the expression of the DNA-damage marker
γH2AX in liver cancer cells with TP53 mutations while lower γH2AX together with functional upregulation of p53 and p21cip1 were observed in TP53 wild-type liver cancer cell lines post-XL413
treatment. c, Representative neutral-comet-assay images of liver cancer cells with TP53 mutations (Hep3B and Huh7) and liver cancer cells with wild-type TP53 (SK-Hep1 and Huh6) treated with
XL413 for seven days. d, Heat map displays fold gene-expression changes (expressed in log2) in cells with wild-type TP53 (BJ and SK-Hep1) and liver cancer cells with TP53 mutations (Huh7 and
Hep3B) upon treatment with XL413 (10 μM, 4 days). e, GSEA was performed on RNA-sequencing data from Hep3B, Huh7, SK-Hep1 and BJ cells treated with 10 μM XL413 for 4 days; this identified
DNA-repair signatures (recombinational repair and Fanconi anaemia pathway) to be significantly different between cells with TP53 mutations and cells with wild-type TP53 (Methods). f, Neutral
comet assays were performed on SK-Hep1 and Huh6 cells treated with 20 μM XL413 combined with AZD6738 (ATR inhibitor, 2.5 μM) or MK-8776 (CHK1 inhibitor, 2.5 μM) for 3 days. The value of
tail moments in each treatment group were normalized on the basis of the mean value of the control cells (n = 50 cellsper cell line and condition). Graphs represent mean ± s.d., analysed
with unpaired two-sided Student’s t-test. g, h, H2B–GFP Hep3B and Huh7 cells were cultured in absence or presence of XL413 (10 μM), and time-lapse microscopy was performed over 96 h to
measure the length of mitosis. Graphs represent mean ± s.d. n = 30 cells per cell line and condition, analysed with unpaired two-sided t-test. i, Mouse cell models of liver cancer with
different genetic backgrounds (NrasG12V;MycOE;Trp53−/− and NrasG12V;MycOE;Cdkn2aARF−/−) were exposed to the indicated concentrations of CDC7 inhibitors (XL413, LY3177833 or TAK-931) for
seven days in colony-formation assays. j, Western blot analysis of mouse cell models of liver cancer treated with XL413, LY3177833 or TAK-931 for seven days. For gel source images, see
Supplementary Fig. 1. Data in a–c, f, g, h are representative of two independent biological experiments. Data in i, j are representative of three independent biological experiments.
a, Lung-cancer cell lines with TP53 mutations (blue) and lung-cancer cell lines with wild-type TP53 (red) were seeded at low confluence and grown in the absence or presence of XL413 at the
indicated concentration for 10–14 days in colony-formation assays. b, Lung-cancer cells were exposed to 10 μM XL413 for 4 days, which induces senescence selectively in cells with TP53
mutations (as detected by SA-β-gal staining). c, Expression of p53 was assessed in isogenic TP53−/− and TP53+/+ HCT116 colon-cancer cell lines by western blot. d, HCT116 TP53+/+ and HCT116
TP53−/− cells were seeded at low confluence and grown in the absence or presence of XL413 at the indicated concentration for seven days in a colony-formation assay, to assess their
proliferation capacity. e, HCT116 TP53+/+ and HCT116 TP53−/− cells were cultured in the presence of 10 μM XL413 for 4 days, and senescence was selectively induced in TP53−/− HCT116 cells (as
detected by SA-β-gal staining). For gel source images, see Supplementary Fig. 1. Data in a–e are representative of two independent biological experiments.
a, Schematic of the GPCR-compound screen. Huh7 cells were treated with 10 μM XL413 for 5 days before seeding in 96-well plates. All compounds were tested at four concentrations for six days,
and cell viability was measured using CellTiter-Blue assay. b, c, Graph depicting the effects of compounds on cell viability. Each point represents a single compound, with per cent activity
calculated by dividing the cell viability score in the presence of 5 μM of that compound by the mean viability of the negative control. Blue dots indicate compounds that induce cell death
in both control and XL413-induced senescent cells. Sertraline (red dot) induced selective cell death in XL413-induced senescent cells. Representative images of the effects of compounds on
XL413-treated and untreated cells are shown. d, Control cells and XL413-induced senescent cells were sequentially cultured with increasing concentrations of sertraline for 48 h and apoptotic
cells were visualized by caspase-3 and caspase-7 apoptosis assay. e, Control and XL413-treated cells were sequentially exposed to 10 μM sertraline, and growth curves were measured by
Incucyte live-cell assay. Graphs represent mean ± s.d. from three technical replicates. f, Control and XL413-treated cells were sequentially treated with vehicle or 10 μM sertraline for 96 h
in colony-formation assays. g, Control and XL413-treated Huh7 and Hep3B cells were treated with sertraline (10 μM) for 24 h, and western blot analyses of the indicated proteins of the mTOR
signalling pathway were performed. h, Hep3B and Huh7 cells were treated with 10 μM XL413 for 10 days before sequential treatment with sertraline (10 μM, 24 h), and RNA sequencing was
performed. GSEA indicates that the gene set related to downregulation of mTOR signalling was negatively enriched in liver cancer cells that were sequentially treated with XL413 and
sertraline (Methods). i, j, Liver cancer cells with TP53 mutations (SNU449 and PLC/PRF/5) and lung-cancer cell lines with TP53 mutations (NCI-H358 and PC9) were treated with 10 μM XL413 or
vehicle for 5–7 days, and sequentially exposed to increasing concentrations of AZD8055. Apoptotic cells were visualized by caspase-3 and caspase-7 apoptosis assay 96 h after treatment with
AZD8055. k, Liver cancer cells with TP53 mutations (Hep3B and Huh7) were treated with 10 μM XL413 or vehicle for 7–10 days. Control cells and XL413-induced senescent cells were plated and
exposed to increasing concentrations of the mTORC1 and mTORC2 inhibitor AZD2014. Apoptotic cells were visualized by caspase-3 and caspase-7 apoptosis assay 96 h after treatment with AZD2014.
l, Liver cancer cell lines with wild-type TP53 (SK-Hep1 and Huh6) were treated with 10 μM XL413 or vehicle for 5–7 days before exposure to increasing concentrations of AZD8055. Apoptotic
cells were visualized by caspase-3 and caspase-7 apoptosis assay 96 h after treatment with AZD8055. m, Control cells and XL413-induced senescent cells were treated with AZD2014 for
48 h. Western blot analysis was performed with the indicated antibodies (left) and the levels of phosphorylated S6RP and phosphorylated 4EBP1 were normalized to the total levels of S6RP and
4EBP1, respectively (right); this shows that treatment with AZD2014 leads to strong inhibition of mTOR signalling in XL413-induced senescent cells. For gel source images, see Supplementary
Fig. 1. Data in a–f are representative of three independent biological experiments. Data in h–m are representative of two independent biological experiments.
a, Control cells and XL413-treated Hep3B cells were treated with AZD8055 for 48 h, and extracted proteins were analysed using a human phosphorylated-RTK array kit (left). The levels of
phosphorylated RTK proteins were normalized to positive controls (right). b, The activation of RTKs identified by RTK arrays and the phosphorylation of SHP2 were validated by western blot
analyses. c, Hep3B cells were treated with AZD8055 for 48 h before extraction of mRNA, and quantification of the indicated genes for RTK proteins was performed by qRT–PCR. Graph represents
mean ± s.d. from three technical replicates. d, Hep3B cells were treated with AZD8055, and cell lysates were collected at the indicated time points to perform western blot analyses with the
indicated antibodies. e, Hep3B cells were exposed to increasing concentrations of the AKT inhibitor MK-2206 in combination with AZD8055, and long-term colony-formation assays were performed;
this revealed the synergistic effects of these two compounds on cell viability. f, Hep3B cells were treated with AZD8055, MK-2206 or a combination of both compounds at the indicated
concentrations for five days, and apoptotic cells were visualized by caspase-3 and caspase-7 apoptosis assay. For gel source images, see Supplementary Fig. 1. All experiments shown (except
for the RTK array analyses) are representative of two independent biological experiments.
a, BJ/ET/RASV12 cells were treated with 100 nM 4-OHT for 21 days to induce senescence, as detected by SA-β-gal staining. b, Control or senescent BJ/ET/RASV12 cells were treated either with
vehicle or with 400 nM AZD8055 for 96 h, and apoptotic cells were visualized by caspase-3 and caspase-7 apoptosis assay. c, Hep3B cells were cultured in the presence of cisplatin or
alisertib (aurora-A kinase inhibitor) for 4 days at the indicated concentrations, and the induction of senescence was detected by SA-β-gal staining. d, Hep3B cells were treated with
cisplatin (1 μg ml−1) or alisertib (250 nM) for 4 days, and subsequently exposed to vehicle or 400 nM AZD8055 for 96 h. Apoptotic cells were visualized by caspase-3 and caspase-7 apoptosis
assay. e, Control cells, or cisplatin-, alisertib- or XL413-induced senescent cells were treated with AZD8055, and cell lysates were collected at the indicated time points. Western blot
analyses were performed with the indicated antibodies, which revealed that the mTOR signalling feedback loop is functional in cisplatin- and alisertib-induced senescent cells (whereas it is
efficiently inhibited in XL413-induced senescent cells). For gel source images, see Supplementary Fig. 1. Data in a–e are representative of two independent biological experiments.
a, Representative images of γH2AX and SA-β-gal staining performed on formalin-fixed, paraffin-embedded or frozen sections from subcutaneous Huh7-tumour xenografts treated with vehicle,
XL413, AZD8055 or combination of both for 12 days. b, Representative images of SA-β-gal staining performed on frozen sections from subcutaneous SK-Hep1-tumour xenografts treated either with
vehicle or with XL413 for 21 days. c, Tumour-volume measurements in mice bearing Huh7- and MHCC97H-tumour xenografts, treated with vehicle, XL413, AZD8055 or a combination of both, at
endpoint (12 days for Huh7 and 22 days for MHCC97H). For sample sizes, see Fig. 4a. One mouse in the vehicle group and one mouse in the XL413 group were excluded from the analysis, because
the maximum permitted tumour volumes (2,000 mm3) were reached in these mice before the endpoint of the trial. Graph shows mean ± s.e.m., analysed with two-sided unpaired Student’s t-test. d,
e, Longitudinal progression of tumour volume in mice bearing Huh7 and MHCC97H tumours, treated with vehicle or sorafenib for 16 or 22 days; this revealed that sorafenib therapy has limited
efficacy in these two xenograft models. Graph shows mean ± s.e.m. f, g, Representative images of haematoxylin and eosin (H & E), PCNA, cleaved caspase-3 and phosphorylated 4EBP1 staining
performed on formalin-fixed, paraffin-embedded Huh7 and MHCC97H xenografts from mice killed after the last dose of vehicle, XL413, AZD8055 or a combination of both drugs. Data in a, b, f, g
are representative of three independent biological experiments.
a, Schematic of hydrodynamic-tail-vein gene delivery of the Myc proto-oncogene transposon system and a CRISPR–Cas9 vector targeting either Trp53 or the Pten tumour suppressor, used to induce
models ofHCC two to three weeks after HDTVi. b, Quantification of SA-β-gal staining performed on frozen sections from mouse models of MycOE;PtenKO or MycOE;Trp53KO HCC, 14 days after
treatment with vehicle or XL413 monotherapy (results from MycOE;Trp53KO HCC are also shown in Fig. 4f). For analyses of MycOE;PtenKO tumours, vehicle-treated, n = 9 biologically independent
nodules from 3 mice; XL413-treated, n = 16 biologically independent nodules from 3 mice. For analyses of MycOE;Trp53KO tumours, vehicle-treated, n = 41 biologically independent nodules from
7 mice; XL413-treated, n = 81 biologically independent nodules from 11 mice. Graph shows the mean ± s.e.m. of the number of SA-β-gal+ cells per tumour nodule per mm2. Statistics were
calculated by two-sided unpaired Student’s t-test. c, Trial design to evaluate the efficacy of the pro-senescence treatment combined with an mTOR inhibitor in mice bearing MycOE;Trp53KO HCC.
Mice were monitored by weekly MRI after HDTVi, and enrolled into treatments with vehicle, XL413 (100 mg kg−1, daily gavage), AZD8055 (20 mg kg−1, daily gavage) or XL413 + AZD8055
combination at the first signs of tumour development (revealed by MRI). Drugs were administered six days per week, and mice were killed when they became symptomatic. Immunohistochemical
analyses confirmed MYC expression and p53 knockout in endpoint MycOE;Trp53KO HCC. d, Longitudinal individual-body-weight curves from mice bearing MycOE;Trp53KO tumours, treated with the
combination of XL413 + AZD8055. e, Individual tumour-growth curves from mice treated with vehicle, XL413, AZD8055 or a combination of both drugs were calculated on the basis of MRI images
from mice bearing MycOE;Trp53KO tumours. f, Volumes of MycOE;Trp53KO tumours from mice bearing HCC, treated with vehicle (n = 5, as shown in Fig. 4c), sorafenib (n = 4) or XL413 + AZD8055 (n
= 6) at day 0 and day 14. Graphs show mean ± s.e.m., analysed with two-sided unpaired Student’s t-test. g, h, Representative images of SA-β-gal (g) and p16 (h) staining performed on frozen
and paraffin-embedded sections, respectively, from mice bearing MycOE;Trp53KO tumours, treated with the indicated drugs and killed at the intermediate time point (14–16 days in time-matched
treated cohorts). Quantifications are shown in Fig. 4f, g. Scale bar, 50 μm. i, Mice bearing MycOE;Trp53KO tumours, treated with vehicle, XL413, AZD8055 or a combination of both drugs were
killed at the indicated time point after treatment. Tumours were dissociated as single-cell suspensions, and flow cytometry analyses were performed to determine the content of
tumour-associated macrophages (CD45+ CD11b+Ly6C−Ly6G−), CD8 T cells (CD45+CD3+CD19−NK1.1−CD8+) and CD4 T cells (CD45+CD3+CD19−NK1.1−CD4+) relative to total CD45+ leucocytes. Cell
proliferation (Ki6
7+) was determined within CD8 T cells and CD4 T cell populations. Graphs show mean ± s.e.m., analysed with two-sided unpaired Student’s t-test. Sample sizes are given in Methods. j, Mice
bearing MycOE;Trp53KO HCC were treated with XL413 (n = 20) or XL413 + AZD8055 combination (n = 8) for 14 days. Among the XL413-treated mice, a subset (n = 10) was killed at 14 days after
treatment, concomitantly with the group treated with the combination of drugs. The rest of the XL413-treated mice (n = 10) underwent withdrawal of XL413 for 4 days. The absolute number of
senescent cells per tumour nodule were visualized by SA-β-gal staining, performed on frozen sections and quantified for each treatment group (XL413-treated, n = 60 biologically independent
nodules from 10 mice; XL413-withdrawn, n = 63 biologically independent nodules from 10 mice; XL413 + AZD8055-treated, n = 57 biologically independent nodules from 7 mice). Graphs show mean ±
s.e.m. analysed with two-sided unpaired Student’s t-test. Data in c are representative of three independent biological experiments.
Anyone you share the following link with will be able to read this content: