Extensive loss of past permafrost carbon but a net accumulation into present-day soils
- Select a language for the TTS:
- UK English Female
- UK English Male
- US English Female
- US English Male
- Australian Female
- Australian Male
- Language selected: (auto detect) - EN
Play all audios:
Atmospheric concentrations of carbon dioxide increased between the Last Glacial Maximum (LGM, around 21,000 years ago) and the preindustrial era1. It is thought that the evolution of this
atmospheric carbon dioxide (and that of atmospheric methane) during the glacial-to-interglacial transition was influenced by organic carbon that was stored in permafrost during the LGM and
then underwent decomposition and release following thaw2,3. It has also been suggested that the rather erratic atmospheric δ13C and ∆14C signals seen during deglaciation1,4 could partly be
explained by the presence of a large terrestrial inert LGM carbon stock, despite the biosphere being less productive (and therefore storing less carbon)5,6. Here we present an empirically
derived estimate of the carbon stored in permafrost during the LGM by reconstructing the extent and carbon content of LGM biomes, peatland regions and deep sedimentary deposits. We find that
the total estimated soil carbon stock for the LGM northern permafrost region is smaller than the estimated present-day storage (in both permafrost and non-permafrost soils) for the same
region. A substantial decrease in the permafrost area from the LGM to the present day has been accompanied by a roughly 400-petagram increase in the total soil carbon stock. This increase in
soil carbon suggests that permafrost carbon has made no net contribution to the atmospheric carbon pool since the LGM. However, our results also indicate potential postglacial reductions in
the portion of the carbon stock that is trapped in permafrost, of around 1,000 petagrams, supporting earlier studies7. We further find that carbon has shifted from being primarily stored in
permafrost mineral soils and loess deposits during the LGM, to being roughly equally divided between peatlands, mineral soils and permafrost loess deposits today.
This study was funded by a French–Swedish cooperation grant from the Swedish Research Council (349-2012-6293), and by the European Union (EU) Joint Programming Initiative (JPI) Climate
Constraining Uncertainties in the Permafrost–Climate Feedback (COUP) consortium. G.H. acknowledges a Marie Curie Skłodowska and Swedish Research Council International Career Grant (INCA; no.
330-2014-6417). We also acknowledge J.-O. Persson at the Department of Mathematics, Stockholm University, who assisted with statistical consulting, and the Bolin Centre for Climate Research
for hosting the data.
Nature thanks V. Brovkin, N. Pastick and the other anonymous reviewer(s) for their contribution to the peer review of this work.
A.L. was responsible for data collection, digitization of data, and analysis of data from past environments, excluding deep loess deposits. P.K. was responsible for the review and analysis
of deep loess deposits. G.H. was responsible for estimates of modern carbon pools. All authors contributed substantially to formulating the research idea, interpreting the results and
writing the paper.
Publisher’s note: Springer Nature remains neutral with regard to jurisdictional claims in published maps and institutional affiliations.
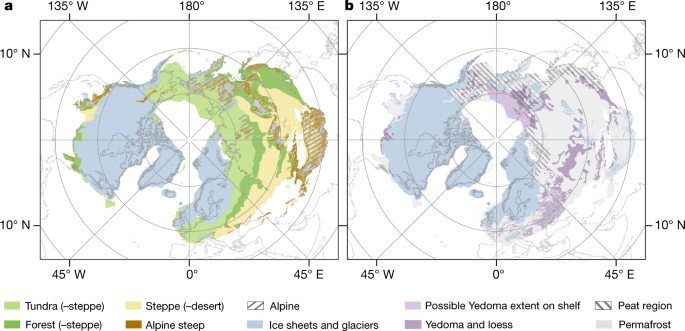
The reconstructed peat region is based on already-reconstructed areas40,41, Sphagnum spore evidence, and the occurrence of peat42,43 or peaty layers44,45,46,47,48,49. The colouring and size
of these points show the percentage of the total pollen sum that was spores (not algae) and our interpretation of the reliability of the dating. Indicative ages are better constrained than
speculative ages (see Supplementary Information). Evidence of dated peat or peaty deposits is shown in dark brown. Data for ice sheets and glaciers are modified from ref. 82, and the
permafrost region11 is included for reference.
The deposits were compiled from several data sources86,87,88,89,90,91, and separated into sections (shown with Roman numerals) as described in Methods and Supplementary Information. The
loess extent outside of the LGM continuous permafrost region is included for reference89. A tentative area of Yedoma extent on the shelf is also included. We assume that this area had the
same degree of dissection as the Yedoma on land (see Supplementary Information). Data for ice sheets and glaciers are modified from ref. 82, and the permafrost region11 is included for
reference. PF, permafrost.
Assemblages of mammoths, horses, bison, reindeer, wholly rhinoceroses and muskoxen17,31,32 dated to between 18 kyr bp and 26 kyr bp indicate an environment that was productive enough to
support megafauna (see Supplementary Information). Note that none of the data points within the Fennoscandian Ice Sheet are younger than 19 kyr bp. Data for ice sheets and glaciers are
modified from ref. 82.
The map shows the major biomes within the LGM permafrost region, constructed from three separate empirical maps15,16,17, as well as our additional separation of alpine environments and steep
areas18. Biomized pollen data and macrofossil findings9,33,34,35,36 were compared with the reconstruction to assess its accuracy (see Supplementary Information). Data for ice sheets and
glaciers are modified from ref. 82.
The organic soil (peat) coverage was calculated from data within the NCSCDv2 database for flat terrain only (see Supplementary Information). The data were aggregated into classes of
continentality, determined from the map65 of the Gorczynski continentality index66 (see Methods). The trend indicates that peat coverage in flat terrain is lower in regions with high
continentality (R2 = 0.4) than in regions of low continentality.
To estimate LGM soil carbon, we used databases to calculate carbon-transfer functions for different biomes. The colouring describes the continuous and discontinuous sections that were
separated before applying the biomes as a second filter. Modern-day biomes were overlain with modern-day carbon stocks in permafrost terrain, providing biome-specific information that was
translated into transfer functions (see Methods).
Cold-based areas are assumed to retain the carbon storage formed before the glaciation. Warm-based ice sheets and glaciers, on the other hand, are erosive, and we assume no preserved carbon
storage. Data for ice sheets and glaciers are modified from ref. 82, and the permafrost region11 is included for reference.
This file contains further description of methods and discussions to clarify our results and includes a full text of our review of deep deposits. It also includes Supplementary Tables 1 and
2. Supplementary Table 1 shows the confusion matrix for the biome reconstruction with ground truth. This table complements the kappa index of accuracy between reconstructed biomes (polygons)
and independent point data of biomized pollen counts [9, 33–36]. The point data (103 points) were harmonized into the three mega biomes following the same priority scheme of forest
(–steppe) > tundra (–steppe) > steppe (–desert). Supplementary Table 2 shows the sectors, number of sites and publications used for the loess reconstruction. This table describes which
publications have been used in the analysis of loess and Yedoma areas. It also specifies how many of the publications from each sector include information such as depth of the deposit, dry
bulk density (DBD) and per cent organic carbon (%OC). The deposit depth interval is split up between a younger and older period.
This file contains Supplementary Table 3, which shows the area and geochemical properties of loess and Yedoma. Total area and geochemical properties by sector of the 71–19-kyr C stock in
current Yedoma deposits, total area and inferred C stocks by sector for other 71–19-kyr loess deposits within the LGM continuous permafrost zone, and currently remaining C stocks in these
deposits (following thaw). The area and depth by sector of other 71–19-kyr loess deposits in the LGM discontinuous permafrost zone are given for reference.
This file contains Supplementary Table 4, which shows a detailed overview of soil carbon stocks for the LGM and present. Soil C stocks are partitioned into detailed categories, described in
column A. For each category, we report area, carbon stock, errors (see Methods for detailed description of different error calculations), and the size of the inert C stock and its errors. An
additional sensitivity analysis of the inert C stock is given beneath the main part of the table. This is based on varying the assumptions of permafrost coverage within the discontinuous
zone (10% to 90%), and the depth of the active layer (100 cm instead of 30 cm). These errors are included in the overall errors given for the LGM inert C storage. All errors given in row 39
are calculated as the sum of squared errors by column.
Anyone you share the following link with will be able to read this content: