Critical evaluation of (110) texture in lithium electrodeposits on isotropic cu polycrystals
- Select a language for the TTS:
- UK English Female
- UK English Male
- US English Female
- US English Male
- Australian Female
- Australian Male
- Language selected: (auto detect) - EN
Play all audios:
ARISING FROM Q. Zhao et al. _Nature Communications_ https://doi.org/10.1038/s41467-021-26143-9 (2021) In their paper, Zhao et al.1 claimed enable to electrodeposit dominantly (110)-oriented
lithium films on polycrystalline Cu foil of random orientation, and reported that the textured growth of metal Li electrode in battery enhances its cycling reversibility by regulating
morphology. The crystallographic texture (preferred orientation) was quantified using the intensity fraction of 110 reflection in each _θ_–2_θ_ scan of X-ray diffraction (XRD). There appear
to be errors in methodology used for evaluating texture. Our interpretations on the XRD data don’t support the dominant (110) texture of lithium electrodeposits. It is worth noting that the
terminology of texture or preferred orientation is rarely seen in Zhao’s paper. The texture is instead described using various inappropriate phrases, including preferred crystal facet
orientation, preferred crystal facets, crystal facet orientation, crystallographic facets, crystal facet, and crystallography. The quantitation of (_hkl_) texture is measure of the volume
fraction _f_v(_hkl_) of crystallites having the orientation (_hkl_) within the spread of ΔΩ. Zhao et al.1 claimed the Li electrodeposits of dominant (110) texture, meaning that the texture
fraction _f_v(110) of each Li film exceeds at least 50%. Before the conclusion was drawn, they should quantify the _f_v(110) value of each Li film by calculating its crystallographic
orientation distribution function (ODF). For this purpose, X-ray pole figure combined with electron diffraction (ED) and transmission electron microscopy (TEM) could be the preferred
method2,3,4,5,6,7. In Zhao’s paper, unfortunately, neither X-ray pole figure nor TEM/ED evidence is available. Instead, Zhao et al.1 preferred _θ_–2_θ_ scan XRD, which cannot give much
information about ODF. Based on the _θ_–2_θ_ scans in Fig. S3 of their paper, Zhao et al.1 emphasized the high intensity-fractions of 110 peak ranging from 88.3% to 91.2% (see supplementary
Table 1 in Zhao’s paper) and then draw the conclusion of dominant (110) texture in their Li electrodeposits. Actually, they quantified (110) texture using the intensity fraction
\({p}_{110}=\frac{\Sigma {I}_{{hh}0}}{\Sigma {I}_{{hkl}}}\)8\(,\) here _I__hkl_ denotes the measured integrated intensity of _hkl_ peak. From PDF #15-0401 for lithium powder, we know
\({I}_{110}^{*}\)/\({I}_{200}^{*}\)/\({I}_{211}^{*}\) ≈ 100/30/40. Then we obtain \({p}_{110}^{*}\) of ≈51.5−58.8% for Li powder depending on the number of _hkl_ peaks used, much higher than
the expected \({f}_{{{{{{\rm{v}}}}}}}^{*}(110)\) value of ≈2.3% for Li powder when the maximum tilt deviation angle _ψ_max of (110) orientation is 5°. Here
$${f}_{{{{{{\rm{v}}}}}}}^{*}\left(110\right)={m}_{110}\frac{\Delta \Omega }{4{{\pi }}}=6{{\times }}(1-{{{{{\rm{cos }}}}}}{{{\psi }}}_{{{{{{\rm{max }}}}}}}),$$ (1) where _m_110 = 12 is the
multiplicity factor of {110} planes, ΔΩ is the solid angle of a spherical crown within the _ψ_max and 4_π_ the solid angle of the pole spherical surface. Therefore, it is totally wrong to
quantify (110) texture with the intensity fraction \({p}_{110}\). As we know, it is unreliable and incorrect to make any quantitative assessment of (110) texture with the Lotgering degree of
orientation \({f}_{110}=\frac{{p}_{110}-{p}_{110}^{*}}{1-{p}_{110}^{*}}\)9,10,11\(.\) Such indiscriminate assessments give usually an overestimated value of texture4,5,6,9. Quantifying
(110) texture with the \({p}_{110}\) is even stray farther away, see Table 1. In a symmetric _θ_–2_θ_ scan the lattice planes contributing to reflection _I__hkl_ are all oriented parallel or
nearly parallel to the film surface. Only a subset of grains is monitored, for which the plane normal lies in an angle window ΔΩw around the substrate normal, when ΔΩw characterizes the
divergence of the X-ray beam received by the point detector. Here, ΔΩw ≈ _π_Δ_ψ_Δ_ω_/4, where Δ_ψ_ and Δ_ω_ in unit of radian are the diameters of angle window parallel and perpendicular to
the diffraction plane, respectively12,13. If the ΔΩw covered the tilt spread ΔΩ of (110) texture, the _f_v(110) values of the Li electrodeposits could be roughly estimated from the intensity
ratio of the 110 peak to a nearby peak _hkl_11. In order to balance the intensity fluctuation of weak 200 and 211 peaks, their total intensity is chosen to represent the diffraction
contributions from the randomly oriented Li component. From Equation (10) in ref. 11. one can know \(\frac{{I}_{200}+{I}_{211}}{{I}_{110}}{{\propto
}}\frac{1-{f}_{{{{{{\rm{v}}}}}}}(110)}{{f}_{{{{{{\rm{v}}}}}}}(110)}\). Similarly, we can write \(\frac{{I}_{200}^{*}+{I}_{211}^{*}}{{I}_{110}^{*}}{{\propto
}}\frac{1-{f}_{{{{{{\rm{v}}}}}}}^{*}(110)}{{f}_{{{{{{\rm{v}}}}}}}^{*}(110)}\) for powder. Division of the two formulas yields
$$\frac{{I}_{200}+{I}_{211}}{{I}_{110}}\frac{{I}_{110}^{*}}{{I}_{200}^{*}+{I}_{211}^{*}}\frac{1-{f}_{{{{{{\rm{v}}}}}}}^{*}(110)}{{f}_{{{{{{\rm{v}}}}}}}^{*}(110)}=\frac{1-{f}_{{{{{{\rm{v}}}}}}}(110)}{{f}_{{{{{{\rm{v}}}}}}}(110)}.$$
(2) Supposing that Δ_ψ_Δ_ω_ ≈ 6° × 1.5°, which is a typical possible angle window of diffractometer12, we can calculate \({f}_{{{{{{\rm{v}}}}}}}^{*}\left(110\right)={m}_{110}\frac{\Delta
{\Omega }_{{{{{{\rm{w}}}}}}}}{4{{\pi }}}=\frac{3}{4}\Delta {\psi }\Delta {\omega }\,{{\approx }}\,0.21\%\). Then the possible _f_v(110) values are estimated to be from 1.10% to 1.49% based
on Eq. (2), see Table 1. Obviously, the _θ_–2_θ_ scans with high \({p}_{110}\) of 88.3%–91.2% could come from the Li deposits of slight (110) texture, further confirming that it is incorrect
to quantify (110) texture with \({p}_{110}\). It is easily understandable that the intensity ratio \(\frac{{I}_{110}}{{I}_{200}+{I}_{211}}\) increases from 100/70 to 1000/79 as long as the
_f_v(110) value rises from 0.21% to 1.49% when the angle window ΔΩw covers the texture spread ΔΩ. For evaluating the real (110) texture of each Li deposit, nevertheless, we have to know its
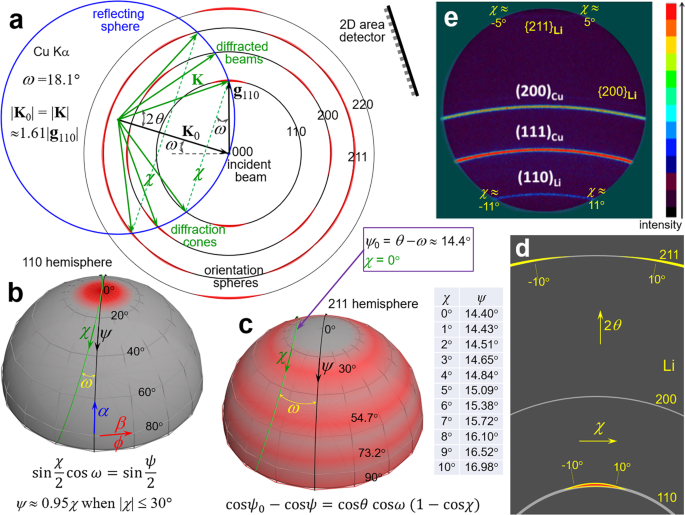
ODF. Generally, a two-dimensional (2D) XRD pattern provides much more information about ODF than a _θ_−2_θ_ scan. The texture can be derived from analysis of the intensity variations along
Debye-Scherrer rings7. Unfortunately, the 2D patterns shown in Zhao’s paper present a limited sector of the homogeneous diffraction rings without noticeable intensity change. This fact
suggests intuitively that the Li deposits might be of nearly random orientation with slight (110) texture. This possibility would be more reasonable if some diffractometer-specific intensity
corrections are considered when the _f_v(110) values are estimated using Eq. (2). For example, the relative intensity of 110 peak from film sample increases significantly at lower 2_θ_
angles due to the increment of diffraction volume, whereas such effect is generally very weak in the case of powder sample. Please note that the penetration thickness _t_0 of Cu _Kα_
radiation in metal Li is ≈2.63 cm, much thicker than the Li film thicknesses of 35−108 μm. Meanwhile, we need consider another possibility that the (110) texture is so scattered that the
intensity variations along the Debye rings occur beyond the sector available, see our analysis in Fig. 1, although the well-distributed intensity along the 110 ring in Fig. 1e disagrees with
the gradual intensity change in usual textured cases. In this possible case, the absence of intensity variation along the weak 211 ring within |_χ_| ≤ 5° demonstrates that the tilt spread
Δ_ψ_ of (110) texture should be ≤15°. This means that the 2D detector employed is large enough for collecting the intensity variations along the Debye rings. We encourage Zhao et al.1
collect two 2D frames with either 110 or 211 ring in the middle of the 2D detector, and then merge them into a diffraction pattern7. The homogeneous 110 ring in Fig. 1e might indicate that
the Li deposit has well-distributed pole density within the \({{\psi }}_{{{{{{\rm{max }}}}}}}\) of 10°. In this possible case, we could calculate
\({f}_{{{{{{\rm{v}}}}}}}^{*}\left(110\right)\) using Formula (1) and then estimate the possible _f_v(110) values with Eq. (2), see Table 1. At this moment, the estimated _f_v(110) values of
34.7%–41.9% may not be true because no ODF of any Li deposit can be unambiguously derived from the 2D patterns in Zhao’s paper. In summary, it is incorrect to quantify (110) texture with the
intensity fraction \({p}_{110}\). The XRD data in Zhao’s paper are insufficient to support the Li electrodeposition of dominant (110) texture. Zhao et al.1 need provide new convincing
evidences to prove their claim of dominant (110) texture in the electrodeposited Li films on isotropic Cu polycrystals. DATA AVAILABILITY The data that support the findings of this study are
available from the corresponding author (Prof. Chaojing Lu) upon reasonable request. CODE AVAILABILITY No custom code or mathematical algorithm is used in the manuscript. REFERENCES * Zhao,
Q. et al. On the crystallography and reversibility of lithium electrodeposits at ultrahigh capacity. _Nat. Commun._ 12, 6034 (2021). Article ADS CAS Google Scholar * Birkholz, M.,
Fewster, P. F. & Genzel, C. in _Thin Film Analysis by X-ray Scattering: Texture and Preferred Orientation._ Ch. 5 (WILEY-VCH Verlag GmbH & Co. KGaA, 2006). * Lee, H. N., Hesse, D.,
Zakharov, N. & Gösele, U. Ferroelectric Bi3.25La0.75Ti3O12 films of uniform _a_-axis orientation on silicon substrates. _Science_ 296, 2006–2009 (2002). Article ADS CAS Google Scholar
* Lu, C. J. et al. Anisotropic ferro- and piezoelectric properties of sol-gel grown Bi3.15Nd0.85Ti3O12 films with two different orientations on Pt/Ti/SiO2/Si. _Appl. Phys. Lett._ 89,
062905 (2006). Article ADS Google Scholar * Lu, C. et al. Oriented growth and ferroelectric anisotropy of sol-gel derived Bi3.15Nd0.85Ti3O12 thin films on Nb-doped SrTiO3. _Phys. Stat.
Sol. (a)_ 205, 2711–2715 (2008). Article ADS CAS Google Scholar * You, P. et al. Growth of highly near-_c_-axis oriented ferroelectric LiNbO3 thin films on Si with a ZnO buffer layer.
_Appl. Phys. Lett._ 102, 051914 (2013). Article ADS Google Scholar * He, B. B. _Two-dimensional X-ray Diffraction: Texture Analysis._ Ch. 8; _Multiple Frame Merge._ Sec. 6.6. 2nd edn
(John Wiley & Sons, 2018). * Zheng, J. et al. Textured Electrodes: Manipulating built-in crystallographic heterogeneity of metal electrodes via severe plastic deformation. _Adv. Mater._
34, 2106867 (2022). Article CAS Google Scholar * Jones, J. L., Slamovich, E. B. & Bowman, K. J. Critical evaluation of the Lotgering degree of orientation texture indicator. _J.
Mater. Res._ 19, 3414–3422 (2004). Article ADS CAS Google Scholar * Lu, C. & Tang, L. Comment on “Spin coating epitaxial films”. _Science_ 365, eaay3894 (2019). Article ADS CAS
Google Scholar * Lu, C., Sun, S. & Duo, Y. Inkjet printing epitaxial metal halide perovskites on various substrates? _Adv. Funct. Mater._ 31, 2100694 (2021). Article CAS Google
Scholar * Moras, K., Fischer, A. H., Klein, H. & Bunge, H. J. Experimental determination of the instrumental transparency function of texture goniometers. _J. Appl. Cryst._ 33,
1162–1174 (2000). Article CAS Google Scholar * Wcislak, L. et al. Texture analysis with high-energy synchrotron Radiation. _J. Appl. Cryst._ 35, 82–95 (2002). Article CAS Google Scholar
Download references ACKNOWLEDGEMENTS This work was supported by the Natural Science Foundation of Shandong Province, China (ZR2021ME070). C.L. acknowledges useful discussion with Dr.
Shiduo Sun and Miss Xinyu Wang as well as some members of national masters science forum. AUTHOR INFORMATION AUTHORS AND AFFILIATIONS * State Key Laboratory of Bio-Fibers and Eco-Textiles,
Qingdao University, 266071, Qingdao, Shandong, China Chaojing Lu * College of Physics, Qingdao University, 266071, Qingdao, Shandong, China Zongta Luo Authors * Chaojing Lu View author
publications You can also search for this author inPubMed Google Scholar * Zongta Luo View author publications You can also search for this author inPubMed Google Scholar CONTRIBUTIONS C.L.
and Z.L. analyzed data and wrote paper. CORRESPONDING AUTHOR Correspondence to Chaojing Lu. ETHICS DECLARATIONS COMPETING INTERESTS The authors declare no competing interests. ADDITIONAL
INFORMATION PUBLISHER’S NOTE Springer Nature remains neutral with regard to jurisdictional claims in published maps and institutional affiliations. RIGHTS AND PERMISSIONS OPEN ACCESS This
article is licensed under a Creative Commons Attribution 4.0 International License, which permits use, sharing, adaptation, distribution and reproduction in any medium or format, as long as
you give appropriate credit to the original author(s) and the source, provide a link to the Creative Commons license, and indicate if changes were made. The images or other third party
material in this article are included in the article’s Creative Commons license, unless indicated otherwise in a credit line to the material. If material is not included in the article’s
Creative Commons license and your intended use is not permitted by statutory regulation or exceeds the permitted use, you will need to obtain permission directly from the copyright holder.
To view a copy of this license, visit http://creativecommons.org/licenses/by/4.0/. Reprints and permissions ABOUT THIS ARTICLE CITE THIS ARTICLE Lu, C., Luo, Z. Critical evaluation of (110)
texture in lithium electrodeposits on isotropic Cu polycrystals. _Nat Commun_ 13, 5673 (2022). https://doi.org/10.1038/s41467-022-32949-y Download citation * Received: 21 December 2021 *
Accepted: 23 August 2022 * Published: 30 September 2022 * DOI: https://doi.org/10.1038/s41467-022-32949-y SHARE THIS ARTICLE Anyone you share the following link with will be able to read
this content: Get shareable link Sorry, a shareable link is not currently available for this article. Copy to clipboard Provided by the Springer Nature SharedIt content-sharing initiative