Annual cycle observations of aerosols capable of ice formation in central Arctic clouds
- Select a language for the TTS:
- UK English Female
- UK English Male
- US English Female
- US English Male
- Australian Female
- Australian Male
- Language selected: (auto detect) - EN
Play all audios:
The Arctic is warming faster than anywhere else on Earth, prompting glacial melt, permafrost thaw, and sea ice decline. These severe consequences induce feedbacks that contribute to
amplified warming, affecting weather and climate globally. Aerosols and clouds play a critical role in regulating radiation reaching the Arctic surface. However, the magnitude of their
effects is not adequately quantified, especially in the central Arctic where they impact the energy balance over the sea ice. Specifically, aerosols called ice nucleating particles (INPs)
remain understudied yet are necessary for cloud ice production and subsequent changes in cloud lifetime, radiative effects, and precipitation. Here, we report observations of INPs in the
central Arctic over a full year, spanning the entire sea ice growth and decline cycle. Further, these observations are size-resolved, affording valuable information on INP sources. Our
results reveal a strong seasonality of INPs, with lower concentrations in the winter and spring controlled by transport from lower latitudes, to enhanced concentrations of INPs during the
summer melt, likely from marine biological production in local open waters. This comprehensive characterization of INPs will ultimately help inform cloud parameterizations in models of all
scales.
Aerosols are an important component of the atmosphere through their impacts on climate, yet the magnitude of their effects remains unquantified1. The largest uncertainties stem from the
indirect effects of aerosols on clouds, which are poorly represented in models2. This deficiency is especially true for the central Arctic Ocean, in part, due to a dearth of observations and
understanding of clouds and aerosols collocated in space and time3. Evaluating aerosol-cloud interactions in this subregion is critical given the heightened sensitivity of the surface
energy budget to cloud phase over sea ice.
While the enigmatic behavior of clouds causes an incomplete understanding of their role in the Arctic climate system, previous efforts agree on some general qualities. Arctic clouds are most
frequent in autumn and least in winter4. Over the sea ice, they impart seasonally-contrasting radiative impacts, warming the surface for most of the year while cooling it for a short period
in summer5,6. Arctic mixed-phase clouds (AMPCs) composed of liquid and ice are persistent7 and common, occurring 41% of the time on average and up to 70% of the time during the spring and
autumn transition seasons8. The ability for models to predict the sea ice seasonal cycle largely depends on accurate depictions of AMPCs because of their strong influence on the surface
energy budget, but the magnitude of their impact on downwelling radiation inherently depends on the relative amounts of liquid vs. ice5,9. However, models struggle to represent seasonal
variation in AMPCs without significant biases4. Further, inter-model differences in Arctic cloud occurrence throughout the year are driven by inadequate parameterizations, motivating the
need for observations of fundamental microphysical processes4,10.
Cloud formation requires the presence of aerosols11. At supercooled liquid temperatures (–38 to 0 °C), the primary pathway for cloud ice formation is immersion freezing by ice nucleating
particles (INPs)12, wherein aerosols are first immersed in cloud droplets followed by freezing once optimal conditions are met. The dominant types of Arctic INPs have been shown to comprise
of mineral and biological materials, emanating from land (e.g., glacial dust13, permafrost14, vegetation15) and the ocean (e.g., sea spray16, biological productivity17,18). At relatively
warm temperatures (above −15 °C)—common among central Arctic clouds throughout the year8—the majority of INPs are typically biological19. Pioneering studies by Bigg et al. during the early
1990s alluded to marine biota as the source of central Arctic INPs20,21. While previous studies characterizing central Arctic INPs are salient, they are also rare, and typically confined to
summer, aside from a single study from March18.
Here, we describe a full annual cycle of size-resolved INPs in the central Arctic. To capture the breadth of INP sources and assess their impacts on Arctic clouds and the surface energy
budget, a complete annual cycle of observations is essential. The Multidisciplinary drifting Observatory for the Study of Arctic Climate (MOSAiC) expedition offered the opportunity to
achieve a holistic characterization of the central Arctic coupled system over the course of a full year (September 2019–October 2020)22, specifically enabling a comprehensive investigation
of atmospheric, oceanographic, and sea ice observations to characterize the sources of INPs. Our findings portray strong seasonality of INPs, with lower concentrations in the winter and
spring controlled by transport from lower latitudes, to enhanced concentrations of INPs during the summer, likely from marine biological production in local open waters.
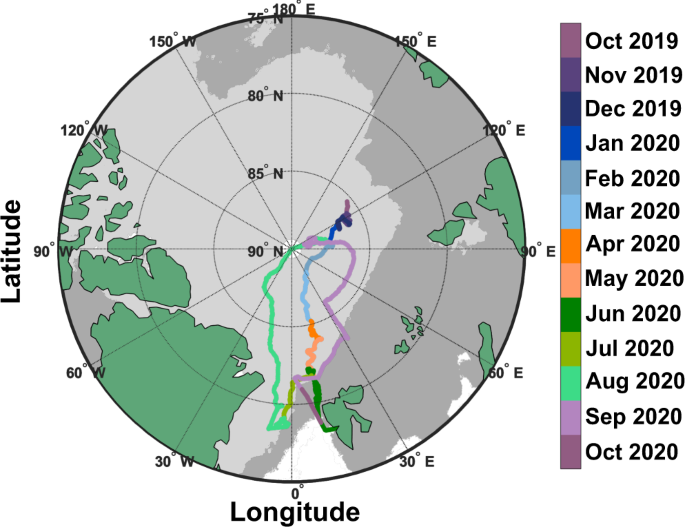
As context for our INP observations, MOSAiC measurements presented here were made onboard the research vessel Polarstern23 as it drifted from the eastern Arctic Ocean, past the North Pole,
and on toward Svalbard, mostly within the central Arctic pack ice (Figs. 1 and 2). Here, we define Arctic autumn, winter, spring, and summer as September–November, December–March, April–May,
and June–August, respectively22. Open lead area fraction (i.e., cracks in the pack ice that expose open ocean) around Polarstern reached a maximum of 6% in early May, while melt pond
fraction reached its maximum of 37% in early August. The concentration of sub-ice chlorophyll-a (chl-a)—a proxy for biomass of marine primary producers—was consistent with what has been
previously reported for the central Arctic Ocean24, peaking in June–July. The coldest air temperature (down to –42 °C) occurred toward the end of winter, while, following the melt onset in
late May, the warmest (up to 3 °C) was observed during the 24-h sunlit summer when air and surface temperature hovered around 0 °C22. The summer experienced relatively calmer wind (4.5 ± 1.8
m s−1 on average) compared to the rest of the year (5.9 ± 2.6 m s−1 on average).
The ship track is colored by date. Only dates that involved ice nucleating particle (INP) sample collection are shown. Dark and light gray shaded areas represent the maximum and minimum sea
ice extent (sea ice concentration ≥15%) in March and September 2020, respectively. Maps were created by the authors using MathWorks MATLAB (https://www.mathworks.com/products/matlab.html).
a Latitude measured on Polarstern and the Central Observatory (CO) at “Met City”, with transit periods denoted. b Sea ice concentration (SIC), and percentage of open water in the form of
leads and melt ponds within a 1 × 1 degree grid around Polarstern. Lead percentage is multiplied by 10 to show variability. c Underway chlorophyll-a (chl-a) concentration measured from
samples collected on Polarstern (values = number of discrete samples). d Temperature (temp) from the aerosol inlet on Polarstern and at the ice surface, and e wind speed (wind spd) colored
by direction (N north, E east, S south, and W west), from “Met City”. All data aside from chl-a are either collected as or averaged daily. Error bars indicate standard deviation of the
calculated averages.
Airmass trajectory analyses provided a broader perspective for the conditions at Polarstern. Figure 3 shows the sea ice concentration (SIC) along the pathways of transport to Polarstern over
the course of 3 days back ending at 30 m above mean sea level (AMSL) in time colored by average transport latitude, and corresponding average transport height. The same analysis for 5 and 7
days back in time, and ending at 100 m AMSL, is shown in the Supplementary Information and yielded similar results (Supplementary Figs. 1 and 7). We note that the trajectory analyses do not
enable us to determine the exact origin of the airmasses, but, in tandem with complementary observations, provide insight into the possible source regions of the measured INPs. On average,
3-day airmasses mostly resided over the pack ice (70% of the time) with some passing over the marginal ice zone (MIZ; 27% of the time), and infrequently over ice-free open water or land (3%
of the time, mostly during port transits). Extended periods throughout autumn and spring were subject to central Arctic transport from over pack ice, while episodic periods of transport from
over the MIZ occurred in winter and summer. Height along the 3-day trajectories varied but typically remained below 500 m (87% of the time), especially when airmasses arrived from over the
pack ice. Overall, these sea ice, ocean, and meteorological observations drive the annual variability of INPs and shed light on the probable sources of these influential particles.
a The average sea ice concentration (SIC) along each 3-day airmass backward trajectory endpoint. Trajectories were initiated daily at 00:00 UTC and at 30 m above mean sea level (AMSL) above
Polarstern with endpoints every 6 h back in time. The dashed lines indicate the thresholds for pack ice (85–100%), the marginal ice zone (15–85%), and ice-free ocean or land (0–15%).
Threshold definitions were obtained from the Norwegian Polar Institute (https://www.npolar.no/en/themes/the-marginal-ice-zone/). b Corresponding altitude along each 3-day trajectory averaged
at all end points. Error bars indicated standard deviation of the daily averages.
INP concentration was lowest in winter and highest in central Arctic summer (Fig. 4), which agrees with year-long Arctic measurements made at lower-latitude, coastal locations25. The
seasonal cycle was shaped by a combination of a relatively consistent presence of cold-temperature INPs (active at