Mapping of quantitative trait loci for life history traits segregating within common frog populations
- Select a language for the TTS:
- UK English Female
- UK English Male
- US English Female
- US English Male
- Australian Female
- Australian Male
- Language selected: (auto detect) - EN
Play all audios:
ABSTRACT The evolution of complex traits is often shaped by adaptive divergence. However, very little is known about the number, effect size, and location of the genomic regions influencing
the variation of these traits in natural populations. Based on a dense linkage map of the common frog, _Rana temporaria_, we have localized, for the first time in amphibians, three
significant and nine suggestive quantitative trait loci (QTLs) for metabolic rate, growth rate, development time, and weight at metamorphosis, explaining 5.6–18.9% of the overall phenotypic
variation in each trait. We also found a potential pleiotropic QTL between development time and size at metamorphosis that, if confirmed, might underlie the previously reported genetic
correlation between these traits. Furthermore, we demonstrate that the genetic variation linked to fitness-related larval traits segregates within _Rana temporaria_ populations. This study
provides the first insight into the genomic regions that affect larval life history traits in anurans, providing a valuable resource to delve further into the genomic basis of evolutionary
change in amphibians. You have full access to this article via your institution. Download PDF SIMILAR CONTENT BEING VIEWED BY OTHERS SMALL-SCALE POPULATION DIVERGENCE IS DRIVEN BY LOCAL
LARVAL ENVIRONMENT IN A TEMPERATE AMPHIBIAN Article 21 September 2020 THE FIRST LINKAGE MAP FOR AUSTRALO-PAPUAN TREEFROGS (FAMILY: PELODRYADIDAE) REVEALS THE SEX-DETERMINATION SYSTEM OF THE
GREEN-EYED TREEFROG (_LITORIA SERRATA_) Article Open access 04 August 2023 ON THE GENETIC ARCHITECTURE OF RAPIDLY ADAPTING AND CONVERGENT LIFE HISTORY TRAITS IN GUPPIES Article Open access
08 March 2022 INTRODUCTION Revealing the genetic architecture behind adaptive processes is a fundamental issue in evolutionary biology. In particular, information about the location, effect
size, and number of loci controlling the life history-related traits is essential for understanding the mechanisms of evolutionary change (Lynch and Walsh 1998; Mackay 2001; Barton and
Keightley 2002). In this context, quantitative trait locus (QTL) mapping has been one of the most widely used tools to identify genomic regions that control important adaptive traits in wild
populations (Slate 2005; Charmantier et al. 2014; Bendesky et al. 2017). Larval traits, such as developmental time, size at metamorphosis, and growth rate, are thought to be under strong
natural selection (Collins 1975; Berven and Gill 1983; Houde 1997; Peckarsky et al. 2001; Barton et al. 2014; Eck et al. 2015) driven by the environmental factors that affect growth
opportunities such as predation, desiccation risk, and thermal conditions (Laurila and Kujasalo 1999; Rodríguez-Muñoz et al. 2001; Fischer and Karl 2010; Tejedo et al. 2010). Among them,
temperature is of paramount importance in shaping life-history variations (Atkinson 1994; Gotthard 2001; Angilletta et al. 2004). For instance, a low temperature slows down the metabolism,
especially in ectotherms, with direct consequences on growth and development rates. Ectotherms from high altitudes and latitudes often exhibit countergradient variations (i.e., rapid growth
and development rates) in order to compensate for these unfavourable environmental conditions and time constraints (reviewed by Conover et al. 2009). These organisms increase their food
conversion efficiency and allocate their available energy at the expense of other purposes (Angilletta et al. 2004); thus, a rapid growth might also entail some trade-offs related, for
example, to locomotor performance (Cano and Nicieza 2006) or immune function (De Block et al. 2008). Therefore, knowing the genomic basis of growth and metabolic rates is critical to
understand the mechanisms behind the adaptive divergence in ectotherms. Furthermore, this is highly relevant to understand how ectothermic organisms will deal with environmental variations
such as climate change (Atkinson 1994; Angilletta et al. 2004; Umina et al. 2005; Johnston and Bennett 2008). Amphibians are ectothermic animals distributed worldwide and they inhabit a wide
range of environmental conditions, which make them good models to study adaptive processes (Miaud and Merilä 2001; Beebee 2005). In addition, since planned crosses can be easily conducted
by artificial fertilization, the quantitative genetic basis of larval life history traits can be characterized (e.g., Berven and Gill 1983; Laurila et al. 2002; Palo et al. 2003; Laugen et
al. 2005). These studies suggest that many larval traits have a significant heritable component. For instance, development time, weight at metamorphosis, and GR exhibit significant additive
genetic variation (Travis 1981; Berven 1987; Laurila et al. 2002; Palo et al. 2003; Knopp et al. 2007). However, the magnitude of additive genetic variance and the strength and direction of
their genetic correlations differ among populations and selective environments (Berven and Gill 1983; Cano et al. 2004). In addition to the increasing evidence about the heritable basis of
life history traits, we also need complementary genetic information to uncover the molecular mechanisms responsible for adaptive evolution (Conner and Hartl 2004). For instance, QTL studies
inform about the genomic regions influencing phenotypic variations (Corva and Medrano 2001; Slate 2005; Beraldi et al. 2007; Rothschild et al. 2007; Lv et al. 2016). Genomic regions
controlling body weight and growth rate have been identified in a large number of endotherms such as mouse, pig, and chicken (e.g., Kerje et al. 2003; Jerez-Timaure et al. 2004) and, more
recently, in ectotherms such as nematode and fish (e.g., Gutteling et al. 2007; Vasemägi et al. 2010; Lv et al. 2016). However, in amphibians, only development time has been studied in
relation to the evolution of paedomorphosis in _Ambystoma_ (Voss et al. 2012; Page et al. 2013). The former study identified three QTLs (_met1_, _met2_, and _met3_) explaining 10–11% of
variation in development time by using a linkage map consisting of 185 molecular markers (Voss et al. 2012). The latter study showed that _met1_ genotype affected the expression of 200 genes
during larval development, linking this QTL with thyroid hormone signalling and mitochondrial energetics (Page et al. 2013). In other amphibians, no QTL mapping studies have been published
to date, although scans for footprints of selection (Bonin et al. 2006; Guo et al. 2016) and comparative transcriptome analyses (Yang et al. 2012) have identified a few candidate genes
potentially related to adaptation to high altitudes. In addition, the recent publication of a draft genome assembly and two dense linkage maps for the common frog, _R. temporaria_ (Brelsford
et al. 2016; Palomar et al. 2017), allow to perform efficiently the genome-wide searches of QTLs and candidate genes. Here, we used a high-density linkage map consisting of 7138 molecular
markers to identify, for the first time, the genomic regions controlling the key larval life history traits in the common frog, _R. temporaria_. We crossed two individuals from contrasting
environments (i.e., high and low altitudes) and measured standard metabolic rate, growth rate, development time, and weight at metamorphosis in their F1 offspring to estimate the effect size
and number of QTLs associated to these traits. MATERIALS AND METHODS SOURCE POPULATIONS AND EXPERIMENTAL CONDITIONS A full-sib family was generated by crossing artificially the parents from
two phenotypically and genotypically well-differentiated populations of _R. temporaria_ (Choda 2014; see detailed methods in Palomar et al. 2017). These populations are associated with
different mitochondrial lineages and exposed to contrasting environmental conditions determined by elevation, hydroperiod, and landscape structure. The male was captured from a mountain
area, Vega de Candioches, León, (1687 m.a.s.l.) and the female from a lowland location, river Argonza valley, near Bárcena Mayor, Cantabria, (551 m.a.s.l.), both in Northern Spain. Over 500
embryos were obtained by artificial fertilisation (eggs and sperm were obtained by pressing gently the animal abdomens, a simple procedure during the breeding season) and maintained in
dechlorinated water at 9 °C. At Gosner stage 25 (i.e., gill resorption completed and exogenous feeding started; Gosner 1960), around 300 tadpoles were individualized in 0.8 l tanks with
dechlorinated water following a fully randomised design. Larvae were fed with unrestricted rations of rabbit chow (15% protein, 3% fat, 17% carbohydrate, 10% ash; Cargill España, Martorell,
Barcelona, Spain) until metamorphosis. Animals were reared under conditions of constant photoperiod (12L:12D) and temperature (14.0 ± 0.5 °C). Larvae were checked every day looking for
metamorphs (Gosner stage 46). Metamorphs were euthanized with an overdose of Benzocaine (Ethyl 4-aminobenzoate; Sigma Aldrich, ref.: 112909) and then frozen at −45 °C. PHENOTYPIC
MEASUREMENTS Traits measured in this study are connected with fitness and are related to each other. We measured standard metabolic rate, which is related to growth and development rates as
well as to the size and age at metamorphosis (Blackmer et al. 2005; Careau et al. 2008; Artacho and Nespolo 2009; Burton et al. 2011; Rosenfeld et al. 2015). Standard metabolic rate (SMR)
was measured at Gosner stage 33 (SD = 2.97). We used a flow-through respirometry system consisting of 24 cylindrical chambers (54 mm × 16 mm) immersed in water at a constant temperature of
14 ± 0.5 °C (for a similar set up, see Álvarez and Nicieza 2005; Cano and Nicieza 2006). The metabolic chambers were supplied with oxygen-saturated water at a fixed flow rate of 700 ml/min
controlled by a 24-channel high-precision peristaltic pump (Model ISM934C; ISMATEC, Cole-Parmer GmbH, Germany). Larvae were unfed for 48h and then acclimated for 15h at the respirometry
chambers prior to measuring SMR. The tadpoles were kept in darkness and remained quiescent throughout SMR measurement. We measured the oxygen consumption in a flow-through system by using a
thermostatted cell (MC 100, Strathkelvin Instruments Ltd, Glasgow, UK) housing a microcathode oxygen electrode (Model 1302, Strathkelvin Instruments Ltd) connected to an oxygen meter (Model
SI782 Single/Dual Channel Meter, Strathkelvin Instruments Ltd). The electrode was calibrated against air-saturated water (obtained from the header tank) and against a solution having zero
oxygen saturation (sodium sulphite in 0.01 sodium tetraborate). Bacterial oxygen consumption was prevented by using ultraviolet lamps. All the equipment was exposed to ultraviolet light for
30 min before the procedure. For each tadpole, we measured the oxygen saturation at the outlet of a blank (empty) chamber and at the outlet of the tadpole chamber over a 5-min period. These
measurements were transferred via Strathkelvin software, 929 Oxygen System v01.02, and recorded in a computer for further analysis. SMR was calculated as follows:
$${\mathrm{Vo}}_{\mathrm{2}} \, {\mathrm{ = V}}_{\mathrm{w}} \, {\mathrm{ \times} \, {\Delta C}}_{\mathrm{w}} \, {\mathrm{ \times} \, {So}}_{\mathrm{2}}$$ where _V_o2 (µg/h) is the rate of
oxygen consumption, _V_w is the flow rate (ml H2O/h) through the respirometry chamber, Δ_C_w is the difference in oxygen concentration between the blank and the test chamber (µg O2/ml), and
_S_o2 is the solubility of oxygen in water (µg O2/ml) (Álvarez and Nicieza 2005; Cano and Nicieza 2006). Eventually, peaks in consumption derived from occasional animal movements were
identified and discarded. As a control for body-size variation, we used the residuals of the linear regression of SMR on tadpole mass. In addition, we weighed the tadpoles weekly over a
4-week period (at 35, 42, 49, and 56 days after fertilization, relating to Gosner stages from 26 to 32) with a precision balance (±1 mg). Since the increase of weight at these stages was
linear (Appendix S1), the the growth rate (GR) was measured as the slope of the line that described the linear model between weight and time for each tadpole. Individuals were also weighed
at Gosner stages 42 (W42), emergence of the forelimbs, and 46 (W46), total reabsorption of the tail. Developmenttime (DT) was quantified as the period between fertilization and Gosner stage
42. GENERATION OF RAD LIBRARY AND BIOINFORMATIC ANALYSIS DNA was extracted from 162 frozen metamorphs with the DNeasy Blood and Tissue Kit (Qiagen). Restriction site-associated DNA (RAD)
libraries were prepared, genotypes were called, and a linkage map was constructed as detailed in Palomar et al. (2017). Briefly, DNA from parents and progeny was digested with restriction
enzymes _PstI_ and _BamHI_ and ligated to 94 modified Illumina adapters with T4 DNA ligase. Agarose gel electrophoresis in an E-Gel® iBase™ Power System was used to do the size selection of
400-bp fragments. These fragments were amplified by PCR, purified, and sequenced on two paired end lanes (2 × 100) with the Illumina HiSeq 2000 in an Illumina Genome Analyzer platform. After
quality filter, 91-bp sequences were obtained. Sire sequences were used to generate a reference to align the remaining individuals. PCR duplicates were deleted and sire sequences were
clustered and assembled de novo to obtain this reference. Parent sequences were aligned against this reference and filters of number of reads per contig (from 10 to 1000) and maximum
mismatch (10%) were applied. RAD loci containing single nucleotide polymorphisms (SNPs) fixed for alternative alleles in parents were discarded while loci containing heterozygous SNPs in
each parent were used to align the progeny. Heterozygotes were called when the minor allele count was >10%. In addition to SNPs, 113 microsatellite markers were amplified in a multiplex
reaction as also detailed in Palomar et al. (2017). All molecular markers segregating according to Mendelian fashion (_X_2 test, _p_ value < 0.05) were assigned according to their
segregation pattern _nn_x_np_, _lm_x_ll, ef_x_eg_, _abxcd_, and _hk_x_hk_, and the linkage map was performed under an Logarithm of Odds (LOD) threshold of eight. After filtering, a total of
61 microsatellites and 7077 SNPs from 162 individuals were used to construct a linkage map consisting of 13 linkage groups (for detailed description see Palomar et al. 2017). QTL ANALYSIS We
analysed five traits GR, SMR, W42, W46, and DT from 162 offsprings. The QTL analysis was performed using a half-sib linear regression model (Knott et al. 1996) implemented by the software
GridQTL v3.3.0 (Seaton et al. 2006). This analysis was executed separately for each parent, using either sire or dam as the common parent and sex-specific linkage maps (Palomar et al. 2017).
Firstly, we ran the QTL analysis assuming a single QTL at each linkage group for each trait. Subsequently, we tested a two-QTL model in the linkage groups where QTL was detected. Confidence
intervals were calculated based on bootstrap method on GridQTL. Genome-wise and chromosome-wise significant thresholds were estimated based on a permutation test with 10,000 iterations
(Churchill and Doerge 1994). QTLs were considered “suggestive” when the _p_ value was < 0.05 and “significant” when the _p_ value was < 0.01. Using the mean squared error of the full
model (MSEfull) and mean squared error of the reduced model (MSEreduced), we calculated the percentage of phenotypic variance explained (PVE) by each QTL as PVE =
(MSEreduced-MSEfull)/MSEreduced (Knott et al. 1996). In addition, the phenotypic correlation between traits was calculated using Pearson correlation implemented by function _cor_ in software
R (R Core Team 2013). RAD loci containing genome-wide or suggestive QTLs were used to carry out a blast search using Swiss-Prot (www.uniprot.org/uniprot/) and NCBI
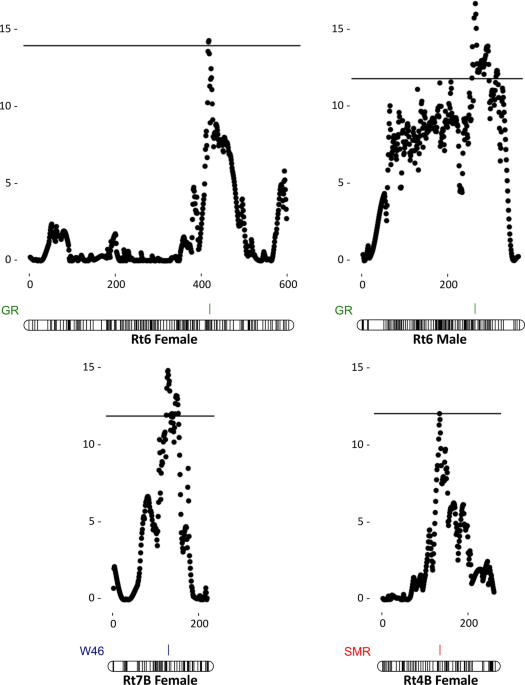
(www.ncbi.nlm.nih.gov/nucleotide) databases to identify the potential candidate genes underlying the variation in the studied traits. RESULTS We identified 12 QTLs (nine suggestive and three
significant) for five life history traits (Table 1; Appendix S2; Appendix S3). We found one significant and two suggestive QTLs in Rt7B (PVE = 8%), in Rt2 (PVE = 6.8%), and in Rt7A (PVE =
4.1%), respectively, influencing W46 and explaining 18.9% of the total variance of this trait. Both female- and male-based analyses found a significant QTL for GR in Rt6 explaining 7.6 and
9.2% of the variance, respectively (Table 1; Fig. 1). In addition, the female-based analysis identified another QTL for GR in Rt8A (PVE = 4.5%). Suggestive QTLs for SMR were localized in Rt6
(PVE = 6.1%) and Rt10 (PVE = 4.3%), and a significant QTL was found in Rt4B, explaining 6.5% of the SMR phenotypic variance. Interestingly, the analysis of segregating QTLs in females
localized a QTL at 33 cM in Rt7A that affects both W42 and DT phenotypes, explaining 5.6 and 5.3% of their phenotypic variances, respectively. This QTL is associated to the markers
16243-75_bb_53, 279698-1_bb_r2_78 and 4533-133_bb_60 (Palomar et al. 2017). Furthermore, we found a relatively strong negative phenotypic correlation between these two traits (Pearson
correlation = −0.62; _p_ value < 2.2 × 10⁻¹⁶). The phenotypic correlation between the rest of the traits was DT-W46 = 0.19 (_p_ value = 0.02), DT-SMR = −0.03 (_p_ value = 0.7), DT-GR =
−0.49 (_p_ value = 3.52 × 10⁻¹¹), W42-W46 = 0.23 (_p_ value = 0.002), W42-SMR = 0.09 (_p_ value = 0.26), W42-GR = 0.55 (_p_ value = 5.12 × 10⁻¹⁴), W46-SMR = 0.01 (_p_ value = 0.88), W46-GR =
0.17 (_p_ value = 0.03), and SMR-GR = −0.01 (_p_ value = 0.88). Models based on two QTLs only supported two suggestive QTLs in Rt7A for DT although their confident intervals overlap. Out of
the thirteen QTL-associated RAD loci blast search found significant similarities only for three QTL regions (Rt2-W46, Rt3-DT, and Rt10-SMR). The suggestive QTL at Rt10 for SMR was close to
Exportin-2 protein in _Xenopus laevis_ (XPO2_XENLA, % identity = 97.436, alignment length 78 bp, _e_ value = 3.78E-62), while the other two suggestive QTLs for W46 and DT mapped close to the
genes A-kinase anchoring protein 10 (XM_018557636.1, % identity = 91.95, alignment length 559 bp, _e_ value = 0), and E3 ubiquitin-protein ligase TRIM39-like (XM_018567747.1, % identity =
76.235, alignment length = 1174 bp, _e_ value = 5.05E-158), respectively, in _Nanorana parkeri_. DISCUSSION Based on the recent dense linkage map of the common frog (Palomar et al. 2017), we
have localized, for the first time in an amphibian genome, regions that control variance in several key early life history traits such as GR, SMR, DT, and size at metamorphosis. For all the
studied traits, except W42 (Table 1; Fig.1), we identified more than one segregating QTL explaining a considerable part of the trait variance. Despite the possibility of missing loci fixed
by the strong selection (Wilkinson et al. 2013) due to our breeding design (i.e., F1 family), we have detected multiple QTLs in line with other mapping studies of important fitness-related
traits (e.g., Andersson et al. 1994; Beraldi et al. 2007; Vasemägi et al. 2010). The lack of fixation in these loci might be associated with weaker selection, antagonistic pleiotropy,
epistatic effects, sexual antagonism, or large mutational target of polygenic traits (Rose 1982; Roff 1992; Fabian and Flatt 2012; Barson et al. 2015). The number of loci that influences
fitness-related life history traits and the magnitude of PVE by these loci are still under debate. A highly polygenic nature has traditionally been expected for fitness-related traits
(reviewed in Merilä and Sheldon 1999) based on the theoretical expectations behind the infinitesimal model for complex traits (Fisher 1930; Orr 2005). While some traits fulfil this
expectation (Goldstein 2009; Boyle et al. 2017), other empirical evidences show that a few loci of large effect can also influence complex traits (Stinchcombe et al. 2009; Barson et al.
2015; Lamichhaney et al. 2016). Our study detected some loci with moderate effects (up to 9% of variation explained) that might be supporting this last empirical evidence. Considering the
tendency of QTL methods to miss loci of small effects and overestimate the QTL effects (Beavis 1998; Matsuba and Merilä 2006; Rockman 2011; Pardo-Diaz et al. 2015; Palomar et al. 2017), it
is possible that many loci with small effects remained undetected. At any rate, the total variance explained by the QTLs found in this study (15.6% for DT, 5.6% for W42, 18.9% for W46, 16.9%
for SMR, and 13.7% for GR) is within the range of additive genetic variance components estimated in quantitative genetic studies of other populations of _R. temporaria_, except for W42. For
instance, Laurila et al. (2002) and Laugen et al. (2005) obtained heritability estimates for DT, body weight at metamorphosis, and GR ranging from 0.11 to 0.33, from 0.12 to 0.40, and from
0.03 to 0.26, respectively, among Swedish populations. Therefore, our QTLs seem to capture well the genetic component of phenotypic variation in the studied traits. Assuming that the
detected QTLs may segregate in other populations, our results also contribute towards understanding the genomic mechanisms behind the relatively rapid adaptive divergence in these traits
(Laugen et al. 2002; Laugen et al. 2003). Interestingly, a QTL at 33 cM of Rt7A associated both DT and W42, suggesting potential pleiotropy. Based on the homology and synteny of the
amphibian genome (Brelsford et al. 2013; Palomar et al. 2017), this genomic region might also participate in the joint control of these traits in other amphibian species and populations. In
fact, a genetic correlation between DT and size at metamorphosis has been reported for Swedish populations of _R. temporaria_ (Laurila et al. 2002) and North American populations of _Rana
sylvatica_ (Berven and Gill 1983). Weight at Gosner stages 42 and 46 has been used often interchangeably as a measure of size at metamorphosis in published studies. However, between the
emergence of the forelimbs (Gosner stage 42) and the total reabsorption of the tail (Gosner stage 46), anurans experience a large number of ontogenetic changes, such as fluctuations in the
concentration of glucocorticoids that entail the increase of glycogen storage (Jaudet and Hatey 1984; Rollins-Smith et al. 1997), maintenance of pronephric degeneration and thyroid
enlargement (Fox 1962; Fox 1966), and modifications in the immune system (Flajnik et al. 1987; Pasquier et al. 1989), which might affect the weight indirectly. Our study found different
genomic regions controlling weight at Gosner stages 42 and 46. Thus, our findings illustrate that QTLs influencing larval weight are not controlled by a fixed set of loci throughout the
process of metamorphosis and are most likely affected by multiple physiological processes and pathways (Denver 2009). A similar pattern has also been found in other organisms such as chicken
(Kerje et al. 2003) or mouse (Corva and Medrano 2001) in which the body weight measured at different stages have been shown to be influenced by different QTLs. This result also supports the
suggestion proposed by Walsh (2010) for unifying the ontogenetic criteria in amphibian studies to use either 42nd or 46th Gosner stage as the end of the larval period. Relatively higher
SMRs can have a positive contribution to fitness due to its link with energy acquisition (Careau et al. 2008; Burton et al. 2011). However, several studies have also reported negative
associations between SMR and survival, growth, or reproductive output (Blackmer et al. 2005; Artacho and Nespolo 2009). The observation of conflicting results, together with intertwined
trade-offs, suggests that the relation between metabolic rate and fitness can be highly complex and likely context dependent (Auer et al. 2015). Therefore, the genomic regions in Rt4B, Rt6,
and Rt10 controlling SMR constitute the first step to further investigate this issue. Furthermore, the potential role of Exportin-2, a protein that imports/exports other proteins into the
nucleus and participates in cell proliferation and apoptosis, needs to be explored in this vein. Finding candidate genes, based on the sequence similarity of short RADseq loci, is
challenging in non-model species. In particular, _R. temporaria_ currently lacks genome annotation, and its closest annotated genome is that of _N. parkeri_, which diverged 90MYA from _R.
temporaria_. The lack of significant BLAST homologies with our identified QTLs highlights the value and urgent need of a high-quality annotated genome for brown frog species (i.e., genus
_Rana_). Furthermore, another challenge to identifying the candidate genes is that typical QTL regions extend over millions of base pairs containing hundreds or even thousands of genes,
which complicates the identification of the causative genes. At a general level, this study contributes to our understanding of the genomic basis of variation in life history traits. We
provide information, for the first time in amphibians, about genomic locations controlling trait variations of well-known adaptive values. Further research using F2 crosses, larger number of
families, and populations would be required to confirm our findings and evaluate with precision the additive, dominance effect and epistatic interactions of the localized QTLs. A
combination of quantitative genetic and genomic approaches focused in the same populations might be particularly powerful. Our results open the possibility for comparative studies to
evaluate whether the location and effect size of the detected QTLs, which control the variance of traits essential in the adaptation process, are shared across the distribution range of the
species. Furthermore, QTLs found in this study will serve as a baseline for further investigation of the genetic basis of larval life history traits and their role in evolutionary change and
adaptation in amphibians in general. DATA ARCHIVING All the information related to the linkage map is detailed in Palomar et al. (2017). Marker sequences are available at
https://figshare.com/s/24fa6c7cd2f133467207. REFERENCES * Álvarez D, Nicieza AG (2005) Is metabolic rate a reliable predictor of growth and survival of brown trout (_Salmo trutta_) in the
wild? Can J Fish Aquat Sci 62:643–649 Google Scholar * Andersson L, Haley CS, Ellegren H, Knott SA, Johansson M, Andersson K et al. (1994) Genetic mapping of quantitative trait loci for
growth and fatness in pigs. Science 263:1771–1774 CAS PubMed Google Scholar * Angilletta MJ, Steury TD, Sears MW (2004) Temperature, growth rate, and body size in ectotherms: fitting
pieces of a life-history puzzle1. Integr Comp Biol 44:498–509 PubMed Google Scholar * Artacho P, Nespolo RF (2009) Natural selection reduces energy metabolism in the garden snail, _Helix
aspersa_ (Cornu aspersum). Evolution 63:1044–1050 CAS PubMed Google Scholar * Atkinson D (1994) Temperature and organism size: a biological law for ectotherms? Adv Ecol Res 25:1–1 Google
Scholar * Auer SK, Salin K, Rudolf AM, Anderson GJ, Metcalfe NB (2015) The optimal combination of standard metabolic rate and aerobic scope for somatic growth depends on food availability.
Funct Ecol 29:479–486 Google Scholar * Barson NJ, Aykanat T, Hindar K, Baranski M, Bolstad GH, Fiske P et al. (2015) Sex-dependent dominance at a single locus maintains variation in age at
maturity in salmon. Nature 528:405 CAS PubMed Google Scholar * Barton M, Sunnucks P, Norgate M, Murray N, Kearney M (2014) Co-gradient variation in growth rate and development time of a
broadly distributed butterfly. PLoS ONE 9:e95258 PubMed PubMed Central Google Scholar * Barton NH, Keightley PD (2002) Understanding quantitative genetic variation. Nat Rev Genet 3:11–21
CAS PubMed Google Scholar * Beavis WD (1998) QTL analyses: power, precision, and accuracy. Mol dissection Complex Traits 1998:145–162 Google Scholar * Beebee T (2005) Conservation
genetics of amphibians. Heredity 95:423 CAS PubMed Google Scholar * Bendesky A, Kwon Y-M, Lassance J-M, Lewarch CL, Yao S, Peterson BK et al. (2017) The genetic basis of parental care
evolution in monogamous mice. Nature 544:434–439 CAS PubMed PubMed Central Google Scholar * Beraldi D, McRae AF, Gratten J, Slate J, Visscher PM, Pemberton JM (2007) Mapping quantitative
trait loci underlying fitness‐related traits in a free‐living sheep population. Evolution 61:1403–1416 PubMed Google Scholar * Berven KA (1987) The heritable basis of variation in larval
developmental patterns within populations of the wood frog (_Rana sylvatica_). Evolution 41:1088–1097 PubMed Google Scholar * Berven KA, Gill DE (1983) Interpreting geographic variation in
life-history traits. Am Zool 23:85–97 Google Scholar * Blackmer AL, Mauck RA, Ackerman JT, Huntington CE, Nevitt GA, Williams JB (2005) Exploring individual quality: basal metabolic rate
and reproductive performance in storm-petrels. Behav Ecol 16:906–913 Google Scholar * Bonin A, Taberlet P, Miaud C, Pompanon F (2006) Explorative genome scan to detect candidate loci for
adaptation along a gradient of altitude in the common frog (_Rana temporaria_). Mol Biol Evol 23:773–783 CAS PubMed Google Scholar * Boyle EA, Li YI, Pritchard JK (2017) An expanded view
of complex traits: from polygenic to omnigenic. Cell 169:1177–1186 CAS PubMed PubMed Central Google Scholar * Brelsford A, Rodrigues N, Perrin N (2016) High‐density linkage maps fail to
detect any genetic component to sex determination in _a Rana temporaria_ family. J Evol Biol 29:220–225 CAS PubMed Google Scholar * Brelsford A, Stöck M, Betto-Colliard C, Dubey S,
Dufresnes C, Jourdan-Pineau H et al. (2013) Homologous sex chromosomes in three deeply divergent anuran species. Evolution 67:2434–2440 PubMed Google Scholar * Burton T, Killen S,
Armstrong J, Metcalfe N (2011) What causes intraspecific variation in resting metabolic rate and what are its ecological consequences? Proc R Soc Lond B Biol Sci 278:3465–3473 CAS Google
Scholar * Cano JM, Laurila A, Palo J, Merilä J (2004) Population differentiation in G matrix structure due to natural selection in _Rana temporaria_. Evolution 58:2013–2020 PubMed Google
Scholar * Cano JM, Nicieza AG (2006) Temperature, metabolic rate, and constraints on locomotor performance in ectotherm vertebrates. Funct Ecol 20:464–470 Google Scholar * Careau V, Thomas
D, Humphries M, Réale D (2008) Energy metabolism and animal personality. Oikos 117:641–653 Google Scholar * Charmantier A, Garant D, Kruuk LEB (2014) _Quantitative genetics in the wild_.
Oxford University Press. Oxford * Choda M (2014). Genetic variation and local adaptations of _Rana temporaria_ in the Cantabrian Mountain. University of Oviedo. * Churchill GA, Doerge RW
(1994) Empirical threshold values for quantitative trait mapping. Genetics 138:963–971 CAS PubMed PubMed Central Google Scholar * Collins JP (1975) A comparative study of the life
history strategies in a community of frogs. University of Michigan * Conner JK, Hartl DL (2004) _A primer of ecological genetics_. Sinauer Associates Incorporated. Sunderland (USA) * Conover
DO, Duffy TA, Hice LA (2009) The covariance between genetic and environmental influences across ecological gradients. Ann N Y Acad Sci 1168:100–129 PubMed Google Scholar * Corva PM,
Medrano JF (2001) Quantitative trait loci (QTLs) mapping for growth traits in the mouse: a review. Genet Sel Evol 33:105–132 CAS PubMed PubMed Central Google Scholar * De Block M, Slos
S, Johansson F, Stoks R (2008) Integrating life history and physiology to understand latitudinal size variation in a damselfly. Ecography 31:115–123 Google Scholar * Denver RJ (2009) Stress
hormones mediate environment-genotype interactions during amphibian development. Gen Comp Endocrinol 164:20–31 CAS PubMed Google Scholar * Eck DJ, Shaw RG, Geyer CJ, Kingsolver JG (2015)
An integrated analysis of phenotypic selection on insect body size and development time. Evolution 69:2525–2532 PubMed Google Scholar * Fabian D, Flatt T (2012) Life history evolution.
Nat Educ Knowl 3:24 Google Scholar * Fischer K, Karl I (2010) Exploring plastic and genetic responses to temperature variation using copper butterflies. Clim Res 43:17–30 Google Scholar *
Fisher RA (1930) _The genetical theory of natural selection: a complete variorum edition_. Oxford University Press. Oxford. * Flajnik MF, Hsu E, Kaufman JF, Du Pasquier L (1987) Changes in
the immune system during metamorphosis of Xenopus. Immunol Today 8:58–64 CAS PubMed Google Scholar * Fox H (1962) A study of the evolution of the amphibian and dipnoan pronephros by an
analysis of its relationship with the anterior spinal nerves. J Zool 138:225–256 Google Scholar * Fox H (1966) Thyroid growth and its relationship to metamorphosis in _Rana temporaria_.
Development 16:487–496 CAS Google Scholar * Goldstein DB (2009) Common genetic variation and human traits. New Engl J Med 360:1696 CAS PubMed Google Scholar * Gosner KL (1960) A
simplified table for staging anuran embryos and larvae with notes on identification. Herpetologica 16:183–190 Google Scholar * Gotthard K (2001) Growth strategies of ectothermic animals in
temperate environments. In: AtkinsonD, Thorndyke M, eds. Environment and animal development 287–304. Oxford BIOS Scientific Publishers * Guo B, Lu D, Liao WB, Merilä J (2016) Genome-wide
scan for adaptive differentiation along altitudinal gradient in the Andrew’s toad _Bufo andrewsi_. Mol Ecol 25:3884–3900 CAS PubMed Google Scholar * Gutteling EW, Riksen JAG, Bakker J,
Kammenga JE (2007) Mapping phenotypic plasticity and genotype–environment interactions affecting life-history traits in _Caenorhabditis elegans_. Heredity 98:28–37 CAS PubMed Google
Scholar * Houde ED (1997) Patterns and consequences of selective processes in teleost early life histories. _Early life history and recruitment in fish populations_. Springer, pp 173–196.
Netherlands Google Scholar * Jaudet GJ, Hatey JL (1984) Variations in aldosterone and corticosterone plasma levels during metamorphosis in _Xenopus laevis_ tadpoles. Gen Comp Endocrinol
56:59–65 CAS Google Scholar * Jerez-Timaure NC, Kearney F, Simpson EB, Eisen EJ, Pomp D (2004) Characterization of QTL with major effects on fatness and growth on mouse chromosome 2. Obes
Res 12:1408–1420 CAS PubMed Google Scholar * Johnston IA, Bennett AF (2008) _Animals and temperature: phenotypic and evolutionary adaptation_, Vol 59. Cambridge University Press.
Cambridge * Kerje S, Carlborg Ö, Jacobsson L, Schütz K, Hartmann C, Jensen P et al. (2003) The twofold difference in adult size between the red junglefowl and White Leghorn chickens is
largely explained by a limited number of QTLs. Anim Genet 34:264–274 CAS PubMed Google Scholar * Knopp T, Cano JM, Crochet P-A, Merilä J (2007) Contrasting levels of variation in neutral
and quantitative genetic loci on island populations of moor frogs (_Rana arvalis_). Conserv Genet 8:45–56 Google Scholar * Knott SA, Elsen JM, Haley CS (1996) Methods for multiple-marker
mapping of quantitative trait loci in half-sib populations. Theor Appl Genet 93:71–80 CAS PubMed Google Scholar * Lamichhaney S, Fan G, Widemo F, Gunnarsson U, Thalmann DS, Hoeppner MP et
al. (2016) Structural genomic changes underlie alternative reproductive strategies in the ruff (_Philomachus pugnax_). Nat Genet 48:84–88 CAS PubMed Google Scholar * Laugen AT, Kruuk
LEB, Laurila A, Räsänen K, Stone J, MerilÄ J (2005) Quantitative genetics of larval life-history traits in _Rana temporaria_ in different environmental conditions. Genet Res 86:161–170 CAS
PubMed Google Scholar * Laugen AT, Laurila A, Merilä J (2002) Maternal and genetic contributions to geographical variation in _Rana temporaria_ larval life-history traits. Biol J Linn Soc
76:61–70 Google Scholar * Laugen AT, Laurila A, Räsänen K, Merilä J (2003) Latitudinal countergradient variation in the common frog (_Rana temporaria_) development rates–evidence for local
adaptation. J Evol Biol 16:996–1005 CAS PubMed Google Scholar * Laurila A, Karttunen S, Merilä J (2002) Adaptive phenotypic plasticity and genetics of larval life histories in two _Rana
temporaria_ populations. Evolution 56:617–627 PubMed Google Scholar * Laurila A, Kujasalo J (1999) Habitat duration, predation risk and phenotypic plasticity in common frog (_Rana
temporaria_) tadpoles. J Anim Ecol 68:1123–1132 Google Scholar * Lv W, Zheng X, Kuang Y, Cao D, Yan Y, Sun X (2016) QTL variations for growth-related traits in eight distinct families of
common carp (_Cyprinus carpio_). BMC Genet 17:65 PubMed PubMed Central Google Scholar * Lynch M, Walsh B (1998) _Genetics and analysis of quantitative traits_. Sinauer, Sunderland, MA,
Vol 1 Google Scholar * Mackay TFC (2001) The genetic architecture of quantitative traits. Annu Rev Genet 35:303–339 CAS PubMed Google Scholar * Matsuba C, Merilä J (2006) Genome size
variation in the common frog _Rana temporaria_. Hereditas 143:155–158 PubMed Google Scholar * Merilä J, Sheldon BC (1999) Genetic architecture of fitness and nonfitness traits: empirical
patterns and development of ideas. Heredity 83:103–109 PubMed Google Scholar * Miaud C, Merilä J (2001) Local adaptation or environmental induction? Causes of population differentiation in
alpine amphibians. Biota 2:31–50 Google Scholar * Orr HA (2005) The genetic theory of adaptation: a brief history. Nat Rev Genet 6:119 CAS PubMed Google Scholar * Page RB, Boley MA,
Kump DK, Voss SR (2013) Genomics of a metamorphic timing QTL: met1 maps to a unique genomic position and regulates morph and species-specific patterns of brain transcription. Genome Biol
Evol 5:1716–1730 PubMed PubMed Central Google Scholar * Palo JU, O’Hara RB, Laugen AT, Laurila A, Primmer CR, Merilä J (2003) Latitudinal divergence of common frog (_Rana temporaria_)
life history traits by natural selection: evidence from a comparison of molecular and quantitative genetic data. Mol Ecol 12:1963–1978 CAS PubMed Google Scholar * Palomar G, Ahmad F,
Vasemägi A, Matsuba C, Nicieza AG, Cano JM (2017) Comparative high-density linkage mapping reveals conserved genome structure but variation in levels of heterochiasmy and location of
recombination cold spots in the common frog. G3: Genes, Genomes, Genetics 7:637–645 CAS Google Scholar * Pardo-Diaz C, Salazar C, Jiggins CD (2015) Towards the identification of the loci
of adaptive evolution. Methods Ecol Evol 6:445–464 PubMed PubMed Central Google Scholar * Pasquier LD, Schwager J, Flajnik MF (1989) The immune system of Xenopus. Annu Rev Immunol
7:251–275 PubMed Google Scholar * Peckarsky BL, Taylor BW, McIntosh AR, McPeek MA, Lytle DA (2001) Variation in mayfly size at metamorphosis as a developmental response to risk of
predation. Ecology 82:740–757 Google Scholar * R Core Team (2013) R Foundation for Statistical Computing. Vienna, Austria 3 * Rockman MV (2011) The QTN program and the alleles that matter
for evolution: all that’s gold does not glitter. Evolution 66:1–17 PubMed PubMed Central Google Scholar * Rodríguez-Muñoz R, Nicieza A, Braña F (2001) Effects of temperature on
developmental performance, survival and growth of sea lamprey embryos. J Fish Biol 58:475–486 Google Scholar * Roff D (1992) _Evolution of life histories: theory and analysis_. Chapman and
Hall, New York Google Scholar * Rollins-Smith LA, Barker KS, Davis A (1997) Involvement of glucocorticoids in the reorganization of the amphibian immune system at metamorphosis. Clin Dev
Immunol 5:145–152 CAS Google Scholar * Rose MR (1982) Antagonistic pleiotropy, dominance, and genetic variation. Heredity 48:63–78 Google Scholar * Rosenfeld J, Van Leeuwen T, Richards J,
Allen D (2015) Relationship between growth and standard metabolic rate: measurement artefacts and implications for habitat use and life‐history adaptation in salmonids. J Anim Ecol 84:4–20
PubMed Google Scholar * Rothschild MF, Hu Z-l, Jiang Z (2007) Advances in QTL mapping in pigs. Int J Biol Sci 3:192 CAS PubMed PubMed Central Google Scholar * Seaton G, Hernandez J,
Grunchec J-A, White I, Allen J, De Koning DJ _et al_. (2006) _Proceedings of the 8th world congress on genetics applied to livestock production_. Belo Horizonte, Brazil, pp 13–18 * Slate JON
(2005) INVITED REVIEW: Quantitative trait locus mapping in natural populations: progress, caveats and future directions. Mol Ecol 14:363–379 CAS PubMed Google Scholar * Stinchcombe JR,
Weinig C, Heath KD, Brock MT, Schmitt J (2009) Polymorphic genes of major effect: consequences for variation, selection and evolution in _Arabidopsis thaliana_. Genetics 182:911–922 PubMed
PubMed Central Google Scholar * Tejedo M, Marangoni F, Pertoldi C, Richter-Boix A, Laurila A, Orizaola G et al. (2010) Contrasting effects of environmental factors during larval stage on
morphological plasticity in post-metamorphic frogs. Clim Res 43:31–39 Google Scholar * Travis J (1981) Control of larval growth variation in a population of _Pseudacris triseriata_ (Anura:
Hylidae). Evolution 35:423–432 PubMed Google Scholar * Umina PA, Weeks AR, Kearney MR, McKechnie SW, Hoffmann AA (2005) A rapid shift in a classic clinal pattern in Drosophila reflecting
climate change. Science 308:691–693 CAS PubMed Google Scholar * Vasemägi A, Gross R, Palm D, Paaver T, Primmer CR (2010) Discovery and application of insertion-deletion (INDEL)
polymorphisms for QTL mapping of early life-history traits in Atlantic salmon. BMC Genom 11:156 Google Scholar * Voss SR, Kump DK, Walker JA, Shaffer HB, Voss GJ (2012) Thyroid hormone
responsive QTL and the evolution of paedomorphic salamanders. Heredity 109:293–298 CAS PubMed PubMed Central Google Scholar * Walsh PT (2010) Anuran life history plasticity: variable
practice in determining the end-point of larval development. Amphib Reptil 31:157–167 Google Scholar * Wilkinson S, Lu ZH, Megens H-J, Archibald AL, Haley C, Jackson IJ et al. (2013)
Signatures of diversifying selection in European pig breeds. PLoS Genet 9:e1003453 CAS PubMed PubMed Central Google Scholar * Yang W, Qi Y, Bi K, Fu J (2012) Toward understanding the
genetic basis of adaptation to high-elevation life in poikilothermic species: a comparative transcriptomic analysis of two ranid frogs, _Rana chensinensis_ and _R. kukunoris_. BMC Genom 13:1
Google Scholar Download references ACKNOWLEDGEMENTS We are indebted to Cristina García, Leticia Viesca, and Antonio Sánchez-Palacio for helping with tadpole care and phenotypic
measurements, Sara Knott and D.J. de Koning for assistance with data analysis and software, and Jaime Bosch and Miguel Tejedo for useful suggestions. We are grateful to the two anonymous
reviewers for improving this article significantly with their contribution. We thank the Government of Castilla y León and Cantabria for providing us the permit to conduct this
investigation. This research was supported by the following grants: Spanish Ministry of Education (references CGL2011-23443 and CGL2012-40246-C02-02), Ministry of Economy and Competitiveness
(reference BES-2012-055220), National Parks Autonomous Agency (OAPN) (reference MARM 428/211), Estonian Ministry of Education and Research (institutional research funding project IUT8-2),
and the Academy of Finland (Grant No. 266321). AUTHOR INFORMATION AUTHORS AND AFFILIATIONS * Research Unit of Biodiversity (UO-CSIC-PA), 33600, Mieres, Asturias, Spain Gemma Palomar, Alfredo
G. Nicieza & José Manuel Cano * Department of Biology of Organisms and Systems, University of Oviedo, 33006, Oviedo, Asturias, Spain Gemma Palomar, Alfredo G. Nicieza & José Manuel
Cano * Molecular and Behavioral Ecology Group, Institute of Environmental Sciences, Jagiellonian University, 30-387, Krakow, Poland Gemma Palomar * Department of Biology, University of
Turku, 20014, Turku, Finland Anti Vasemägi & Freed Ahmad * Department of Aquaculture, Institute of Veterinary Medicine and Animal Science, Estonian University of Life Sciences, 51006,
Tartu, Estonia Anti Vasemägi * Department of Aquatic Resources, Institute of Freshwater Research, Swedish University of Agricultural Sciences, 17893, Drottningholm, Sweden Anti Vasemägi
Authors * Gemma Palomar View author publications You can also search for this author inPubMed Google Scholar * Anti Vasemägi View author publications You can also search for this author
inPubMed Google Scholar * Freed Ahmad View author publications You can also search for this author inPubMed Google Scholar * Alfredo G. Nicieza View author publications You can also search
for this author inPubMed Google Scholar * José Manuel Cano View author publications You can also search for this author inPubMed Google Scholar CORRESPONDING AUTHOR Correspondence to Gemma
Palomar. ETHICS DECLARATIONS CONFLICT OF INTEREST The authors declare that they have no conflict of interest. ADDITIONAL INFORMATION PUBLISHER’S NOTE: Springer Nature remains neutral with
regard to jurisdictional claims in published maps and institutional affiliations. SUPPLEMENTARY INFORMATION APPENDIX S1 APPENDIX S2 APPENDIX S3 RIGHTS AND PERMISSIONS Reprints and
permissions ABOUT THIS ARTICLE CITE THIS ARTICLE Palomar, G., Vasemägi, A., Ahmad, F. _et al._ Mapping of quantitative trait loci for life history traits segregating within common frog
populations. _Heredity_ 122, 800–808 (2019). https://doi.org/10.1038/s41437-018-0175-x Download citation * Received: 16 May 2018 * Revised: 08 December 2018 * Accepted: 12 December 2018 *
Published: 10 January 2019 * Issue Date: June 2019 * DOI: https://doi.org/10.1038/s41437-018-0175-x SHARE THIS ARTICLE Anyone you share the following link with will be able to read this
content: Get shareable link Sorry, a shareable link is not currently available for this article. Copy to clipboard Provided by the Springer Nature SharedIt content-sharing initiative