The effects of visual-field loss from panretinal photocoagulation of proliferative diabetic retinopathy on performance in a driving simulator
- Select a language for the TTS:
- UK English Female
- UK English Male
- US English Female
- US English Male
- Australian Female
- Australian Male
- Language selected: (auto detect) - EN
Play all audios:
ABSTRACT BACKGROUND The purpose of this study was to compare driving-simulator performance of participants with visual-field loss (VFL) from panretinal photocoagulation (PRP) of
proliferative diabetic retinopathy (PDR) with a normally sighted control group. Furthermore, we investigated the effects of VFL of different extent on driving. METHODS Data on performance
and safety from a traffic-simulator test for 27 participants with VFL from PRP of PDR were retrospectively compared with data from 83 individuals without visual deficits in a cross-sectional
study. Individuals with diabetes that regained their driving licences after a successful simulator test were then followed in a national accident database. RESULTS Diabetes participants
passed the test in 56% of the cases. Compared with the control group, diabetes participants had more risky “failed to give way” events and longer reaction times. Failed diabetes participants
had lower mean sensitivity in the superior visual field than those who passed. None of the participants with a regained licence were involved in a motor vehicle accident during the 3–6-year
follow-up after the simulator test. CONCLUSIONS Diabetes participants had worse performance and safety than the controls. However, even individuals with VFL from PRP might drive safely,
which highlights the need for individual assessments in licencing issues. You have full access to this article via your institution. Download PDF SIMILAR CONTENT BEING VIEWED BY OTHERS THE
INFLUENCE OF PERIPHERAL VISION ON DRIVING PERFORMANCE IN PATIENTS IMPLANTED WITH AN INVERTED MENISCUS INTRAOCULAR LENS Article Open access 21 March 2025 DISCREPANCY AND AGREEMENT BETWEEN
SUBJECTIVE SYMPTOMS AND VISUAL FIELD IMPAIRMENT IN GLAUCOMA PATIENTS AT A DRIVING ASSESSMENT CLINIC Article Open access 02 January 2025 MESOPIC CONDITIONS OPTIMISE THE DETECTION OF VISUAL
FUNCTION LOSS IN DRIVERS WITH SIMULATED MEDIA OPACITY Article Open access 01 August 2022 INTRODUCTION Driving a car is inarguably a highly visual task. Countries all over the world have
therefore set visual requirements for holding a driver’s license that usually includes minimum visual acuity and visual field. The relationship between visual-field loss (VFL) and driving is
however far from clear. Some studies have shown that drivers with VFL are more unsafe, others have failed to show any correlation [1]. Comparing results is also complicated as definitions
of both VFL and safe driving vary across studies. Two major outcomes are used in research on driving, safety, and performance. Safety is defined by adverse events, typically collisions that
might be studied in accident statistics or surveys. Performance refers to behavior while maneuvering a vehicle. Both safety and performance may also be tested either on road or in
simulators. On road, driving is obviously more authentic, but it is difficult to test hazardous situations in a systematic way. Simulator tests on the other hand can test attention and
reactions under standardized conditions. However, it is not yet possible to create a perfect imitation of reality in simulators, that also might give severe dizziness (simulator sickness).
In the absence of a strong correlation between visual functions and driving, the ultimate method and cutoff values for vision testing in licensing issues are still left to discover and
visual requirements for driving differ both between and within nations [2]. DIABETES AND VISUAL-FIELD LOSS Proliferative diabetic retinopathy (PDR) is the most common cause of vision
impairment and blindness among working-age adults around the world [3]. Even if intravitreous antivascular endothelial growth-factor (VEGF) injections have emerged as a treatment alternative
the last decade, panretinal photocoagulation (PRP) has been the standard treatment for patients with PDR since the 1970s [4]. Although effective in reducing the risk for severe visual loss,
the destructive nature of laser treatment may also cause peripheral VFL with implications for the patient’s ability to drive. Estimates for the prevalence of VFL sufficient to preclude
driving at 6 months after bilateral PRP range from 10 to 50% [5,6,7]. Empirically, one might expect a close relationship between the total burn area and the degree of visual-field loss. This
might explain why more recent studies of PRP with modern multispot lasers have shown none or very mild visual-field loss [8, 9]. It is further important to note that retinal ischemia from
PDR also causes visual-field changes. In the 5-year results from DRCRnet Protocol S, patients treated with anti-VEGF had similar changes of the visual field as patients treated with PRP
[10]. PREVIOUS STUDIES OF VISUAL-FIELD LOSS FROM DIABETES ON ROAD AND SIMULATED DRIVING Despite the impact of diabetic retinopathy on visual function, few studies have evaluated its
association with driving performance and safety. A case-control study of over 200 drivers involved in motor vehicle accidents has shown that older drivers with diabetic retinopathy have a
similar risk of injurious crash involvement compared with healthy controls [11]. However, this study included no information of severity or treatment of the retinopathy. A small-scale
driving-simulator study of 25 drivers with diabetic retinopathy, about half of them with previous PRP, demonstrated that both laser scarring and retinal thickness negatively impacted driving
performance. Laser scar grades significantly correlated with longer response time [12]. The purpose of this study was to compare driving-simulator performance of participants with VFL from
PRP for PDR with a normally sighted control group. Furthermore, we investigated the effects of VFL of different extents on driving. MATERIALS AND METHODS PARTICIPANTS In the end of 2014 and
beginning of 2015, normally sighted individuals were recruited to perform a driving-simulator test at the Swedish Road and Traffic research institute (VTI) in Linköping. They should state
themselves as healthy, drive approximately 15,000 km/year, and be between 55 and 75 years of age. All of them were screened for visual-field defects with Humphrey perimetry 24–2. These 83
individuals were paid 100 Euro for participation. Their driving behavior was used to create reference values used to define a passed test. Thereafter, between June 2016 and August 2018,
individuals with a withdrawn licence due to VFL could apply for the test. It was initially performed only for research purposes, but a successful test was later accepted by the Swedish
Transport Agency as a cause of dispensation (i.e., return of the driver’s licence), if no other medical complications were present. Nearly all (95%) of the participants therefore knew that
they could have their driver’s license renewed following a successful test. The remaining individuals were also informed of the possibility to use the test result as a cause of dispensation,
which made all participants highly motivated. The cost for the individual was about 2000 euro. Despite the price, the interest was very high. More than 300 individuals with VFL for
different reasons completed the test until August 2018 when the activity was paused for evaluation. The participants attached medical records and visual-field charts when applying for the
simulator test. Diagnosis and visual-field examinations were therefore always done in advance in a clinical setting. Besides PRP for PDR, stroke and glaucoma were other common reasons for
VFL. This study analyzes the result from the driving-simulator test for 27 participants with VFL from a full 360-degree scatter for PDR compared with the control group. Ethical approval was
given by Linköping University Committee (Dnr 2014/124–31). FIELD OF VISION As all diabetes participants had withdrawn licenses, everyone also had severe visual-field loss according to the
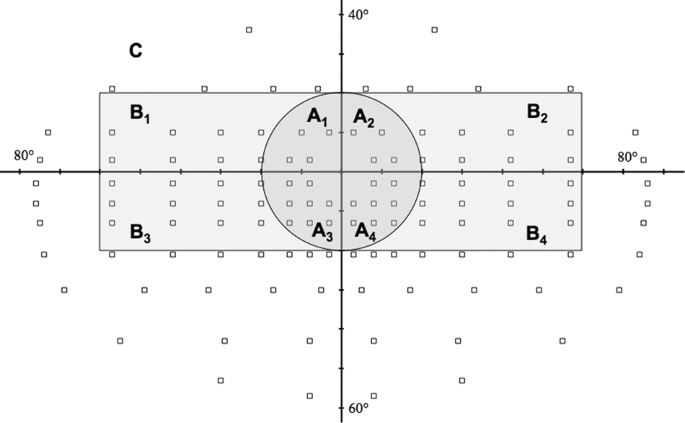
Swedish legislation. To hold a driver’s license in Sweden, the extent of the visual field should be at least 120 degrees horizontal and 40 degrees vertical. More than two adjacent missed
points with Esterman perimetry within this area preclude driving. No missed points are allowed within the central 20-degree radius [13]. To be included in analysis of visual field, an
examination with Esterman program with Humphrey or Octopus perimetry was needed. The number of missed test points in different visual-field clusters was counted for each participant for
comparison (Fig. 1). THE SIMULATOR The driving simulator Sim III consisted of a real truncated car body [14]. Moving road patterns and landscape were shown on a large screen in front of the
car. Six projectors created one seamless image on the screen. The field of view was therefore approximately 140 degrees. By linking the cradle’s motion to the vehicle, the simulator’s motion
algorithm creates realistic lateral motions. Three LCD displays were used to simulate rear-view and side mirrors. A vibration table provided high-frequency reproduction of road unevenness
and moved the compartment/cab relative to the projected image. Even if the simulator resembled an authentic vehicle in almost all respects, it was still a simulated reality, which all
participants knew and understood (Fig. 2). PROCEDURE The procedure was the same for the control group and the diabetes participants in a number of respects. However, the normally sighted
also completed a screening perimetry test, which showed that none had visual-field loss. This group also completed some cognitive tests such as reading span [15]. The pretesting took
approximately one hour. Diabetes participants on the other hand completed the background questionnaire at home before the driving-test session. All participants signed an informed consent
before the test drive. The testing in the simulator started with a practice session for approximately 8 min, giving the participant a possibility to get acquainted with the car (especially
braking and steering behavior). All participants could abort at any time, without giving an explanation (however, all participants completed the test). THE SIMULATOR SCENARIO The driving
scenario contained three types of roads: urban section (speed limit 30–50 km/h), rural road (speed limit 70 km/h), and motorway (speed limit 110 km/h). The drive took approximately 50 min to
complete, depending on the participant’s chosen speed. Thirty-seven events that required a response by the driver were of particular interest for sufficient safety margins. However, the
drive also included situations that were not critical, but were included to provide a feeling of ordinary driving and thus normalize the drivers to a more relaxed driving behavior.
Pedestrians, buses, and cars coming from left or right and sometimes from two directions at the same time were presented. These objects imitated behavior from real life, i.e., pedestrians
could emerge behind a bus to “take a look” if it was possible to pass. The actions made by buses, cars, and pedestrians were initiated by the speed and distance from the car driven by the
participant. The actions of interest (with buses, cars, pedestrians, etc.) were scripted events and the same for all participants. In such a scripted event, several aspects were measured:
speed when a parked bus was seen, speed while passing the bus, position in the lane, braking pressure when the face/body of the pedestrian to detect was visible, brake reaction time,
collisions, distance to bus, and speed passing the pedestrian. The events used in the scenario should also be of different criticality and difficulty, in order to reduce floor or ceiling
effects, i.e., to be able to discriminate between drivers with good safety margins vs. those with insufficient safety margins. During the development of the scenario, it contained turning 90
degrees left and right. However, the pilot testing with individuals at this age revealed that over 50 percent strongly experienced simulator sickness. The final version, and the version
used in this study, therefore did not include any sharp turns. It should also be noted that collisions were not followed by a “crash experience” (sound or vibration etc.). In this way, all
participants could complete the scenario and continue to gather data on performance and safety without negative psychological effects from previous critical driving. ASSESSMENT OF PASSED VS.
FAILED All test results were digitally stored in protocols divided into 37 events together with a video recording of the full driving scenario. This was retrospectively analyzed by two
independent traffic-safety experts, one traffic inspector and one traffic-safety researcher. These did a subjective assessment of the scenario out from risk management, scanning, speed
adjustment, and maneuvering. The assessments were completed with the help of test protocols and video recordings from the simulator. The experts could replay the complete drive on their own
computer screen and move forward or back in time at different speeds if necessary. The assessment was also performed in accordance with reference values from the control group. The
instruction to the traffic inspector (who assesses on road driving on a daily basis) was to use their understanding of a normal driving-licence session. The traffic-safety researcher used
the values in the protocol (THW, speed, brake power, and TTC, etc.) with normally sighted data to a further extent, in combination with the video recordings. Hence, the classification into
pass and fail was still based on a subjective assessment. However, if the experts disagreed in their opinion, a third assessment was performed by an additional traffic-safety researcher.
Disagreements were rare, less than 7% needed a third assessment. DESIGN The design was a between-participant design with diabetes vs. normally sighted as one variable. The dependent measures
used in this study were a passed test, but also several safety and performance parameters. The most important safety parameters were actual collisions and failure to give way and the most
important performance parameters were reaction time and time headway (THW). COLLISIONS The test included 33 possible collisions, including both with other cars and pedestrians. Among these,
7 collisions were to objects in front of the car, 6 in the back, 14 to the right, 2 to the left, and 4 both to the right and to the left. FAILURE TO GIVE WAY Failure to give way (FGW) was a
specific situation where the test driver came too close to a pedestrian, either by stopping too close or by passing too close, measured as the minimal distance to the pedestrian. FGW was
measured 11 times, 7 were to the right and 4 to the left. Distances between 0 and 1 meter were considered as hazardous and distances between 1 and 2 meters as risky. TIME HEADWAY Time
headway (THW) is the distance to different moving objects divided by the experimental vehicle speed [16]. THW was measured 29 times during the test. The number of THW values below 1 s were
considered as critical [17]. REACTION TIME Reaction time was measured 17 times during the test with objects (vehicle or pedestrian) that suddenly appeared and required braking. VELOCITY The
speed on different stretches was recorded from the simulator. Participants drove in three different environments, urban, rural, and motorway. STATISTICAL CONSIDERATIONS The comparisons of
interest was initially between normally sighted and diabetes participants. The second step was to compare passed diabetes participants with failed. The dependent measures used in the study
created different statistical analyses. The alpha level of p < 0.05 was always used. CAR ACCIDENTS AMONG DISPENSATION CASES One part of the evaluation of the simulator-based driving test
was to conduct a follow-up of all individuals that had regained their driving licence after a successful performance in the simulator. The Swedish Traffic Accident Data Acquisition (STRADA)
database was used and includes all road accidents with personal injuries in Sweden reported by the police or emergency hospitals. RESULTS DESCRIPTIVES The diabetes group was slightly younger
than the controls and had a somewhat lower proportion of women. The diabetes participants passed the simulator test in 56% overall (Table 1). Younger participants were not significantly
more successful than older (Fig. 3). DIABETES PARTICIPANTS VS. NORMAL SIGHTED Statistical analysis of average speed (with ANOVA), reaction times, lateral position (with independent t-tests),
collisions, THW events, and FGW events (with Fischer exact test) revealed that diabetes participants drove as fast as normally sighted on all stretches, slower reaction times, and the same
lateral position. Diabetes participants had the same number of collisions, more risky FGW events, and a tendency for more critical THW events (_p_ = 0.08) (Table 1). PASSED-DIABETES
PARTICIPANTS COMPARED WITH FAILED-DIABETES PARTICIPANTS The same analysis as for diabetes versus normally sighted was computed for passed- versus failed-diabetes participants. No significant
differences (_p_ > 0.05) could be detected for average speed, FGW, or lane position. An independent two-tailed _t_-test revealed that the failed diabetes participants had more critical
THW events, meaning that the individuals who passed the test had better safety margins than individuals who failed. Two tendencies were also obtained for collisions and reaction times (_p_ =
0.08 (collisions) and _p_ = 0.08 (reaction time), respectively). CENTRAL TEST POINTS AND SUPERIOR VS INFERIOR VISUAL-FIELD LOSS Visual-field data that met the inclusion criteria were found
in all cases. Although not significant, participants with less than 5 blind test points in the superior cluster (A1, A2, B1, and B2) passed the test in 75% vs. 40% for participants with 5 or
more blind test points in the same area. Failed-diabetes participants had also lower mean sensitivity than passed in the same cluster (_p_ < 0.05 with two-tailed _t_-test). No
significant differences of mean sensitivity could be detected for the remaining clusters (Table 2). CAR ACCIDENTS AMONG DISPENSATION CASES The majority (all except 2) individuals with a
passed test applied for a renewed driver’s license. The 13 individuals that regained their licence had to prove that their visual field defects had not deteriorated in a given interval (e.g.
every second year). All of them still had a driver’s licence 4 years after the test. At the same time, none of them were found involved in a motor vehicle accident according to The Swedish
Traffic Accident Data Acquisition (STRADA). DISCUSSION This study of simulator-driving performance of individuals with visual-field loss from panretinal photocoagulation for proliferative
diabetic retinopathy showed that this group had both worse driver performance and safety margins than a normal-sighted control group. Passed-diabetes participants had better driving
performance and safety margins than failed. Furthermore, passed-diabetes participants had fewer blind-test points than failed in the superior field of vision. To the best of our knowledge,
this is the largest study so far of driving behavior in a simulator for individuals with VFL from PRP for PDR and the only one with defined visual-field clusters. Other strengths of the
study are the detailed simulator scenario and that the patients performed the test with the aim to regain their licenses, which guarantees very good participation. The control group was also
reasonably sex-matched with the study group. This is important as men and women may have different comfort with speed and willingness to take risk. For example, a recent study of gender
differences in simulated driving found that men drove more carefully than women [18]. The study has however also important weaknesses. As we did not have access to the complete medical
records, we could not evaluate the importance of visual acuity, status of retinopathy, number of laser sessions, specific macula treatment or the period from diabetes onset, and panretinal
photocoagulation to the simulator test. We could further not separate a single spot from multispot PRP and analyze if the latter method had fewer negative effects on driving. For the same
reason, we could not divide patients with previous vitrectomy in a separate group. Sharp turns could not be used because of simulator illness, which made the simulator less like reality.
Furthermore, a simulator test also always requires an amount of visual simplification of the roadway. The most important weakness, however, is that the normally sighted participants were not
assessed in terms of passed and failed due to resources (i.e., the availability of traffic inspectors), whereupon we do not know if all controls passed the test. At the same time, the
reference values for a passed test were created based on the results of the normally sighted control group. It should also be noted that the high cost for the testing (2000 Euros) might have
affected the selection of participants in two different ways. Participants with a better economy and participants who believed that they would pass the test were likely overrepresented. It
is therefore not surprising that the success rate was as high as 56%. Individuals with VFL from PRP might be safe drivers, which conforms to previous research [11]. This might be explained
by both optimized performance, as a passed test could lead to return of the driver’s licence, and differences in the severity of PRP in the study group. However, reaction times were longer
for the PRP group than the healthy controls, which also confirms already-known differences during simulated driving [12]. However, it should also be noted that patients with diabetes
mellitus have longer reaction times than nondiabetic persons in response to a visual stimuli, also in the absence of PRP and PDR, possibly caused by neuropathy or impaired cognitive
functions [19]. The PRP participants with a passed test had fewer blind spots in the superior visual field. This has never been studied before but contradicts similar research on patients
with visual-field loss from glaucoma, where patients involved in collisions had lower mean sensitivity in the inferior hemifield [20]. Studies of simulated driving with visual-field defects
from glaucoma [21] or stroke [22, 23] have suggested that drivers might compensate for the impaired detection by increased explorative head and eye movements. This aspect has still not been
studied for patients with diabetes and was unfortunately not a part of the design in the present study. The individuals with a renewed licence had no higher risk of on-road collisions in
reality at follow-up. The significance of this result, however, is unsure due to the low number of licences. Hence, it is not possible to conclude that the simulator assessment developed can
discriminate between safe and unsafe drivers yet. However, the data support that the method is valid, but needs further evaluations. Previous studies have shown that driving-simulator
testing seems to be a well-standardized method with good conformity to on-road driving, appropriate for assessment of driving performance in individuals with binocular visual-field loss
[24]. Compared with individuals that applied for the simulator test for other reasons, diabetes participants had a lower success rate than glaucoma participants (56% compared with 71%). This
result cannot be explained by lower compensatory abilities at higher age, as the diabetes participants were also younger (mean 60 years compared with 69 years). Failed glaucoma participants
had a higher extent of central visual-field loss, but no differences could be found between the superior and inferior visual field [25]. In summary, superior VFL from PRP seems to be more
crucial than inferior. Even if the extent of visual-field loss may predict driver safety on a group level, even drivers with severe visual-field loss might also be safe drivers. It seems
therefore reasonable to provide an opportunity for individualized assessments of practical fitness to drive in licencing issues. Multivariate analysis of visual, attentional, perceptual,
cognitive, and psychomotor abilities combined with a structured-road test might distinguish safe from unsafe drivers [26]. On-road testing by a certified driving examiner is currently
considered the clinical golden standard. However, driving simulators may provide a useful adjunct to a road test for evaluation of responses to potential hazards under safe, controlled, and
repeatable conditions [27]. SUMMARY WHAT WAS KNOWN BEFORE * Panretinal photocoagulation has been the standard treatment for patients with proliferative diabetic retinopathy for a long time.
* Although effective in reducing the risk for severe visual loss, laser treatment may cause peripheral visual field loss with implications for the ability to drive. * The relationship
between visual field loss and driving is far from clear. WHAT THIS STUDY ADDS * Superior visual-field loss seems to be more crucial than inferior for safe driving among individuals with
visual-field loss from panretinal photocoagulation. * However, as even individuals with severe visual-field loss might drive safely, there is a need for individual assessments in licensing
issues. REFERENCES * Owsley C. The vision and driving challenge. J Neuroophthalmol. 2010;30:115–6. Article Google Scholar * Bro T, Lindblom B. Strain out a gnat and swallow a camel? -
vision and driving in the Nordic countries. Acta ophthalmologica. 2018;96:623–30. Article Google Scholar * Yau JW, Rogers SL, Kawasaki R, Lamoureux EL, Kowalski JW, Bek T, et al. Global
prevalence and major risk factors of diabetic retinopathy. Diabetes Care. 2012;35:556–64. Article Google Scholar * The Diabetic Retinopathy Study Research Group. Preliminary report on
effects of photocoagulation therapy. Am J Ophthalmol. 1976;81:383–96. Article Google Scholar * Hulbert MF, Vernon SA. Passing the DVLC field regulations following bilateral pan-retinal
photocoagulation in diabetics. Eye. 1992;6:456–60. Pt 5 Article Google Scholar * Mackie SW, Webb LA, Hutchison BM, Hammer HM, Barrie T, Walsh G. How much blame can be placed on laser
photocoagulation for failure to attain driving standards? Eye. 1995;9:517–25. Pt 4 Article Google Scholar * Buckley SA, Jenkins L, Benjamin L. Fields, DVLC and panretinal photocoagulation.
Eye. 1992;6:623–5. Pt 6 Article Google Scholar * Muqit MM, Wakely L, Stanga PE, Henson DB, Ghanchi FD. Effects of conventional argon panretinal laser photocoagulation on retinal nerve
fibre layer and driving visual fields in diabetic retinopathy. Eye. 2010;24:1136–42. Article CAS Google Scholar * Subash M, Comyn O, Samy A, Qatarneh D, Antonakis S, Mehat M, et al. The
effect of multispot laser panretinal photocoagulation on retinal sensitivity and driving eligibility in patients with diabetic retinopathy. JAMA Ophthalmol. 2016;134:666–72. Article Google
Scholar * Gross JG, Glassman AR, Liu D, Sun JK, Antoszyk AN, Baker CW, et al. Five-year outcomes of panretinal photocoagulation vs intravitreous ranibizumab for proliferative diabetic
retinopathy: a randomized clinical trial. JAMA Ophthalmol. 2018;136:1138–48. Article Google Scholar * McCloskey LW, Koepsell TD, Wolf ME, Buchner DM. Motor vehicle collision injuries and
sensory impairments of older drivers. Age Ageing. 1994;23:267–73. Article CAS Google Scholar * Szlyk JP, Mahler CL, Seiple W, Vajaranant TS, Blair NP, Shahidi M. Relationship of retinal
structural and clinical vision parameters to driving performance of diabetic retinopathy patients. J Rehabil Res Dev. 2004;41:347–58. Article Google Scholar * TSFS 2010:125.
Transportstyrelsens föreskrifter om medicinska krav för innehav av körkort m.m. [The Swedish Transport Agency’s regulations on medical requirements for holding a driving license, etc.].
Available from https://www.transportstyrelsen.se/TSFS/TSFS%202010_125k.pdf. Accessed 2 September 2021. * Nordmark S, Jansson H, Palmkvist G, Sehammar H. The new VTI driving simulator - Multi
purpose moving base with high performance linear motion. Paris, 2004. Driving Simulation Conference; Paris, 2004. * Andersson J, Peters B. The importance of reaction time, cognition, and
meta-cognition abilities for drivers with visual deficits. Cogn Tech Work. 2019. 101007/s10111-019-00619-7 2019. * Mamdoohi AR, Zavareh MF, Hydén C, Nordjaern T. Comparative analysis of
safety performance indicators based on inductive loop detector data. Promet Traffic Transp. 2014;26:139–49. Google Scholar * Östlund J, Peters B, Thorslund B, Engström J, Markkula G,
Keinath A et al. The Adaptive Integrated Driver-vehicle Interface Deliverable D2.2.5: Adaptive integrated driver-vehicle interface. Information Society Technologies Programme; 2005. *
Ferrante C, Varladi V, De Blasiis MR. Gender differences measured on driving performances in an urban simulated environment. In: Cassenti D, editor. Advances in Human Factors and Simulation.
AHFE 2019. Advances in Intelligent Systems and Computing; 2020. 958. * Padilla-Medina JA, Prado-Olivarez J, Amador-Licona N, Cardona-Torres LM, Galicia-Resendiz D, Diaz-Carmona J. Study on
simple reaction and choice times in patients with type I diabetes. Comput Biol Med. 2013;43:368–76. Article Google Scholar * Kunimatsu-Sanuki S, Iwase A, Araie M, Aoki Y, Hara T, Fukuchi
T, et al. The role of specific visual subfields in collisions with oncoming cars during simulated driving in patients with advanced glaucoma. Br J Ophthalmol. 2017;101:896–901. Article
Google Scholar * Kubler TC, Kasneci E, Rosenstiel W, Heister M, Aehling K, Nagel K et al. Driving with Glaucoma: Task Performance and Gaze Movements. Optom Vis Sci. 2015;92:1037–46. * Smith
M, Mole CD, Kountouriotis GK, Chisholm C, Bhakta B, Wilkie RM. Driving with homonymous visual field loss: Does visual search performance predict hazard detection? Br J Occup Ther. 2015;78:
85–95. * Bahnemann M, Hamel J, De Beukelaer S, Ohl S, Kehrer S, Audebert H, et al. Compensatory eye and head movements of patients with homonymous hemianopia in the naturalistic setting of a
driving simulation. J Neurol. 2015;262:316–25. Article Google Scholar * Ungewiss J, Kubler T, Sippel K, Aehling K, Heister M, Rosenstiel W, et al. Agreement of driving simulator and
on-road driving performance in patients with binocular visual field loss. Graefe’s Arch Clin Exp Ophthalmol. 2018;256:2429–35. Article Google Scholar * Bro T, Andersson J. The effects of
visual field loss from glaucoma on performance in a driving simulator. Acta Ophthalmol. 2021; 10.1111/aos.14765 [Epub ahead of print]. * McKnight AJ, McKnight AS. Multivariate analysis of
age-related driver ability and performance deficits. Accid; Anal Prev. 1999;31:445–54. Article CAS Google Scholar * Bowers AR. Driving with homonymous visual field loss: a review of the
literature. Clin Exp Optom. 2016;99:402–18. Article Google Scholar Download references FUNDING This study was funded by Trafikverket, Skyltfonden (TRV 2018/25726). AUTHOR INFORMATION
AUTHORS AND AFFILIATIONS * Department of Ophthalmology Eksjö, Region Jönköping County and Department of Biomedical and Clinical Sciences, Linköping University, Linköping, Sweden Tomas Bro *
Swedish National Road and Transport Research Institute Linköping, Linköping, Sweden Jan Andersson Authors * Tomas Bro View author publications You can also search for this author inPubMed
Google Scholar * Jan Andersson View author publications You can also search for this author inPubMed Google Scholar CONTRIBUTIONS JA was responsible for the study design and extracting data.
TB wrote the report. Both JA and TB analyzed data and interpreted the results. CORRESPONDING AUTHOR Correspondence to Tomas Bro. ETHICS DECLARATIONS COMPETING INTERESTS This study was
funded by Trafikverket, Skyltfonden (TRV 2018/25726). The authors declare no potential conflicts of interest with respect to the research, authorship, or publication of this article.
ADDITIONAL INFORMATION PUBLISHER’S NOTE Springer Nature remains neutral with regard to jurisdictional claims in published maps and institutional affiliations. RIGHTS AND PERMISSIONS Reprints
and permissions ABOUT THIS ARTICLE CITE THIS ARTICLE Bro, T., Andersson, J. The effects of visual-field loss from panretinal photocoagulation of proliferative diabetic retinopathy on
performance in a driving simulator. _Eye_ 37, 103–108 (2023). https://doi.org/10.1038/s41433-021-01832-3 Download citation * Received: 19 January 2021 * Revised: 04 October 2021 * Accepted:
21 October 2021 * Published: 13 January 2022 * Issue Date: January 2023 * DOI: https://doi.org/10.1038/s41433-021-01832-3 SHARE THIS ARTICLE Anyone you share the following link with will be
able to read this content: Get shareable link Sorry, a shareable link is not currently available for this article. Copy to clipboard Provided by the Springer Nature SharedIt content-sharing
initiative