Single-cell transcriptome profiling reveals intratumoural heterogeneity and malignant progression in retinoblastoma
- Select a language for the TTS:
- UK English Female
- UK English Male
- US English Female
- US English Male
- Australian Female
- Australian Male
- Language selected: (auto detect) - EN
Play all audios:
Retinoblastoma is a childhood retinal tumour that is the most common primary malignant intraocular tumour. However, it has been challenging to identify the cell types associated with genetic
complexity. Here, we performed single-cell RNA sequencing on 14,739 cells from two retinoblastoma samples to delineate the heterogeneity and the underlying mechanism of retinoblastoma
progression. Using a multiresolution network-based analysis, we identified two major cell types in human retinoblastoma. Cell trajectory analysis yielded a total of 5 cell states organized
into two main branches, and the cell cycle-associated cone precursors were the cells of origin of retinoblastoma that were required for initiating the differentiation and malignancy process
of retinoblastoma. Tumour cells differentiation reprogramming trajectory analysis revealed that cell-type components of multiple tumour-related pathways and predominantly expressed UBE2C
were associated with an activation state in the malignant progression of the tumour, providing a potential novel “switch gene” marker during early critical stages in human retinoblastoma
development. Thus, our findings improve our current understanding of the mechanism of retinoblastoma progression and are potentially valuable in providing novel prognostic markers for
retinoblastoma.
Retinoblastoma is the most common ocular tumour of childhood and is fatal if left untreated. This malignancy is generally detected in infants or young children under the age of 3 years, and
7–10% of retinoblastomas are diagnosed at the neonatal stage during the first month of life and occasionally at birth [1]. Leucocoria is the most common initial sign of retinoblastoma. The
management of retinoblastoma is complex and involves strategically chosen methods of enucleation, radiotherapy, chemotherapy, laser photocoagulation, cryotherapy, and thermotherapy [2].
Mortality from retinoblastoma is ~70% in countries of low and middle income and 95–97% in developing countries [3]. Retinoblastoma is thought to result from the inactivation of the RB1 gene
[4]. Studies suggest that biallelic RB1 inactivation leads to a non-proliferative retinoma, and progression to retinoblastoma requires additional genetic aberrations [5]. However, the cell
type in which RB1 suppresses retinoblastoma and the circuitry that underlies the need for retinoblastoma are undefined. Furthermore, ~2% of retinoblastomas do not harbour RB1 alterations,
and the presence of genetic alterations beyond RB1 inactivation correlates with aggressive histopathologic features [6].
The two-hit hypothesis states that the development of any retinoblastoma requires two complementary tumour-inducing events to convert a normal retinal cell into a neoplastic cell [7]. The
debate over the cell of origin of human retinoblastoma has lasted for more than a century. There was evidence that retinal progenitor cells (RPCs) and the inner neuroblastic layer (INL),
where bipolar, horizontal and müller transition cells were located, are the cell origins of retinoblastoma [8,9,10]. Although a recent study showed that cone precursors were the most likely
origin, as they had an intrinsic circuitry [11], tumours arising from macula that were rich in cones were fewest in number [12]. The transcriptome of human retinoblastoma had been reported
using bulk tissue RNA-seq [13, 14]. These studies provided general transcriptomic information on retinoblastoma as a whole tissue, but the heterogeneity in retinoblastoma and developmental
lineages of tumour cells were still unknown.
In recent studies, single-cell separation and sequencing technology made it possible to comprehensively profile the human retina [15,16,17,18]. Furthermore, this technology had been applied
to identify unrecognized diversity of cell types in uveal melanoma [19] and provided new insights into age-related macular degeneration [20]. Here, for the first time, we captured molecular
profiles for human retinoblastoma, indicating the cone precursors and retinoblastoma cells differentiation state in which the highly expressed UBE2C gene might serve as an indicator for
evaluating the mature and malignancy of retinoblastoma. Our findings provide insight into the developmental trajectories and cellular states underlying human initiation and progression of
retinoblastoma.
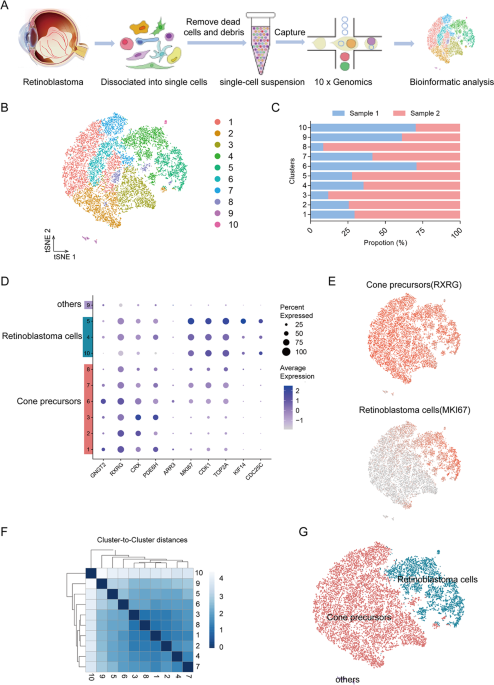
To probe the cell type at single-cell resolution, we performed single-cell RNA sequencing (scRNA-seq) on 14739 single cells from two retinoblastoma tumour samples (Fig. 1A). The patients
were all diagnosed as group E advanced retinoblastoma with endophytic type of tumour growth. Enucleation was the primary treatment without any other treatments (Supplementary Fig. 1,
Supplementary Table 1). Following preprocessing and quality control (QC) (Supplementary Fig. 2A, B), we obtained high-quality transcriptomic data from a total of 14739 cells. The majority of
the sequenced cells had 2991-4172 genes and 9709-16818 median unique molecular identifiers (UMIs) associated with the cell barcodes (Supplementary Fig. 2C). After QC, the scRNA-seq data
were initially analysed using an unsupervised graph clustering approach implemented in Seurat to classify individual cells into cell populations according to similarities in their
transcriptome profiles. Overall, the cells were classified into 10 transcriptionally distinct clusters using a t-distributed stochastic neighbour embedding (t-SNE) plot, where each dot
represented a single cell (Fig. 1B). Each cluster consisted of cells in the range of 53-3610. The proportion of cells in each cluster was shown in Fig. 1C, suggesting relatively low sample
bias. Notably, unsupervised clustering and t-SNE analysis showed the cluster 9 (c9) that was transcriptionally distinct from all other clusters. These results indicated high intratumoural
heterogeneity in retinoblastoma.
A Scheme of cell isolation, cell processing, capture by droplet-based device, sequencing, and downstream analysis. B t-SNE plot of single cells distributed by unbiased hierarchical
clustering. C Fraction of cells in each cell cluster. D Feature expression heatmap showing expression patterns of major retinal class markers across 10 cell clusters. In a given cell
identify, the sizes of circles indicate percentage of the cells expressing each marker gene; The shades of blue indicate average expression of each gene. E t-SNE plots showing expression of
a set of selected marker genes for major retinal classes. F Correlation matrix for the hierarchical clusters. G t-SNE visualization of 14,739 cells profiled, with cells colour-coded
according to cell type annotation.
To identify major cell types in human retinoblastoma, cells-specific genes were used to annotate cell types with classic markers described in previous studies [11, 21]: cone precursors
(GNGT2, RXRG, CRX, PDE6H) and retinoblastoma cells (MKI67, CDK1, TOP2A, KIF14, CDC25C). We then generated cluster-specific marker genes by performing differential gene expression analysis to
define the identity of each cell cluster (Fig. 1D). In most cases, well-known cell type markers were used to identify cell clusters, such as RXRG for cone precursors [11], MKI67 for
retinoblastoma cells [21] (Fig. 1E). As expected, we observed high correlations between the expression levels of transcripts within the same cell type (Fig. 1F). We also identified multiple
additional other retinal cell types markers [15, 17, 20, 22, 23], such as rods (PDE6A, RHO, NR2E3), mature cones (OPN1LW, OPN1MW, OPN1SW), Müller glia (RLBP1, APOE, CLU), retinal astrocytes
(GFAP), microglia (HLA-DPA1, HLA-DRA, C1QA), bipolar cells (VSX2, TMEM215, VSX1), retinal ganglion cells (SNCG, SLC17A6, RBPMS), amacrine cells (CALB1, CHAT, GAD2), and horizontal cells
(ONECUT1, PROX1, LHX1) (Supplementary Fig. 3A). These genes were barely expressed. We observed c9 expressed markers from multiple retinal cell types (Supplementary Fig. 3B). Thus, we were
unable to assign cell identities to the cluster and it was excluded from further analysis. Therefore, our data demonstrated there were at least two types of cells in retinoblastoma. The main
cell types were cone precursors (six clusters: c1-3, and 6-8) and retinoblastoma cells (three clusters: c4, 5 and 10) with multiple transcriptionally distinct clusters (Fig. 1G).
It is not yet clear which retinal cell type is the cancerous origin of retinoblastoma. Some studies supported the origin of retinoblastoma from photoreceptor precursor cells [24], while
accumulating evidence suggested that retinoblastoma was primarily derived from cone precursors [11, 25]. However, these findings were mainly based on observations from transgenic mouse
models and had not been validated in human retinoblastoma. To confirm the cell of origin of retinoblastoma, we performed pseudotime trajectory analysis (Fig. 2A, B). Our data showed that
cone precursors and retinoblastoma cells demonstrated a relatively linear developmental progression. Notably, across the developmental trajectory specific to retinoblastoma, two subtypes of
cone precursors (c7, 8) were present at the branch point 2, followed two branches by retinoblastoma cells (Fig. 2C). The branches separated the cell trajectory into five states (Fig. 2D, E).
To further investigate this ongoing process, we performed RNA velocity analysis to predict the potential direction and speed of cell state transitions. Notably, it was consistent with the
results of pseudotime trajectory analysis (Supplementary Fig. 4). These results suggested that the cone precursor cells might develop into premalignant cone precursors, transform into
retinoblastoma cells in two states.
A, B Trajectory analysis revealing the retinoblastoma progression, colour-coded according to cell clusters (all six subtypes of cone precursors and three subtypes of retinoblastoma cells). C
Pseudotime trajectory analysis of individual clusters (c1, c2, c3, c4, c5, c6, c7, c8, c10). D The trajectory showed state-specific progression patterns in retinoblastoma. E Composition of
the clusters within each cell state. F Heatmap showing the ordering gene expression dynamics during the cellular-state transition process and expression dynamics. State-1 and state-5
reprogramming trajectories (including pre-branch) are shown on the right and left, respectively. G, H Heatmap of KEGG enrichment analysis enrichment by module 3 (G) and module 1 (H).
Next, we analysed the gene expression heatmap of ordering genes in a pseudo-temporal order to elucidate the molecular dynamics that distinguished two branches. Four major gene modules were
identified accounting for the distinctions (Fig. 2F). The data showed the pre-branch (state-3) cell populations at earlier stages and after bifurcation into two branches (state-1 and 5).
Obviously, the state-3 cluster initiated the delamination of retinoblastoma, and branch cells in state-5 expressed higher levels of cell cycle-related genes (Fig. 2G). The branch cells in
state-1 expressed higher levels of genes enriched for the KEGG terms “ribosome”, “mitophagy-animal” and “spliceosome” (Fig. 2H). These results indicated that state-5 cell populations were
gradually shifting the malignancy process, which was indicative of their ongoing maturation.
To further elucidate the cell of origin, we compared the six clusters of cone precursors. Pseudotime trajectory analysis of cone precursors (Fig. 3A, B) suggested that c7 and c8 were
differentiation lately, compared to others cluster (Fig. 3C). As displayed in the heatmap of the average number and distribution of top five differentially expressed genes (DEGs) in each
cone precursors cluster, the transcriptome could be distinguished into two subgroups (c1, 2, 3, 6 and c7,8) according to the proportion of highly expressed genes (Fig. 3D). It has been
reported that RB loss induces cell cycle entry in immature (ARR3−) but not in maturing (ARR3+) cone precursors, as cone precursors were uniquely sensitive to RB depletion in retinoblastoma
cells [26]. Similar observations were also obtained in our jitter plots analysis which showed that RB1 and ARR3 were barely expressed in these cells (Supplementary Fig. 5A, B), suggesting
that the six clusters of cone precursors were immature. In contrast, MYCN was highly expressed in c5 (retinoblastoma cells) a gene played crucial roles in tumour cell proliferation that was
consistent with previous study [25] (Supplementary Fig. 5C). Interestingly, we also observed ATOH7 was relatively high expression in state-4 particularly in c2 (Supplementary Fig. 5D), a
gene promotes cone genesis in human retinal development [23]. These results showed the presence of heterogeneity within cone precursors in retinoblastoma and raised the possibility that cone
precursors might still have potential normal differentiation function in retinoblastoma.
A, B Trajectory analysis revealing the cone precursors progression, colour-coded according to cell clusters (all six subtypes of cone precursors). C Pseudotime trajectory analysis of
individual clusters (c1, c2, c3, c6, c7, c8). D Heatmap displaying normalized expression of top 5 DEGs among six subtypes of cone precursors (c1, c2, c3, c6, c7, c8). E KEGG enrichment
analysis identified the top 20 pathways between c1, c2, c3, c6 and c7, c8. F Violin plot for the expression of cell cycle genes (CCNA2 and CCNB1) in six subtypes of cone precursors (c1, c2,
c3, c6, c7, c8).
Since proliferation was found to be the main feature of retinoblastoma, we then performed functional enrichment analysis for each subgroup and found that the unique functions of subgroup c7,
8 were related to cell cycle (Fig. 3E), which was further supported by the specific expression of cell cycle genes: CCNA2 and CCNB1 (Fig. 3F). Taken together, these results showed that the
subtypes of cone precursors with high cell cycle-related gene expression were the major origin source of retinoblastoma.
The presence of three subtypes of retinoblastoma cells in tumour prompted us to investigate their malignant status. To define malignant cells, we firstly profiled pseudotime trajectory
analysis of retinoblastoma cells (Fig. 4A, B). The three subtypes were inconsistent in transcriptome and gene differentiation (Fig. 4C and Supplementary Table 2). Based on cluster-specific
marker genes in previous studies, we observed c10 strongly expressed the markers of retinoma-like cells (PCNA, CDCA7, MCM3, HELLS) [21], decreasing in c4 and barely in c5 (Fig. 4D). Thus, we
speculated that retinoma-like cells could be an intermediate cell stage between premalignant cone precursors and tumour cells. Meanwhile, the functional enrichment analysis showed that
genes upregulated in c5 cells were mainly enriched for cancer-related functions, such as cell cycle, DNA replication, p53 signalling pathway and apoptosis (Fig. 4E, F).
A, B Trajectory analysis revealing the retinoblastoma cells progression, colour-coded according to cell clusters (all three subtypes of retinoblastoma cells). C Pseudotime trajectory
analysis of individual clusters (c4, c5, c10). D Feature expression heatmap showing expression patterns of select markers across three retinoblastoma cell clusters. The size of each circle
depicts the percentage of cells expressing the marker within the cluster. Purple colour indicated the average expression (number of transcripts). E Heatmap displaying normalized expression
of top 10 DEGs among three subtypes of retinoblastoma cells (c4, c5, c10). F Heatmap of KEGG enrichment analysis enrichment by clusters (c4, c5, c10).
Liu et al. showed that dynamic expression of genes, such as SYK, DEK and NSE from retinoma-like cells to cancerous organoids was strong in the bridge state [21]. To test this possibility, we
firstly characterized the trends of all single cells along pseudotime (Fig. 5A). As expected, we noted that cone precursors were the root cells that were required for initiating the
delamination and migration process of retinoblastoma development, while determination of the fate of retinoblastoma cells was accompanied by increased UBE2C expression (Fig. 5B). The cells
enriched in state-5 at the terminal of the branch shared a highly similar global expression profile with retinoblastoma cells that possess cell cycle (UBE2C, PTTG1, CCNB1) and proliferation
(MKI67) properties (Fig. 5B). In addition, UBE2C represented as a “pivot” gene in retinoblastoma cells branch (Fig. 5C). Meanwhile, the cells enriched in state-1 at the terminal of the
branch maintained high expression profile (MCM7, PCNA) with retinoma-like cells. Similarly, we also detected consistent results in pseudotime heatmap (Fig. 5D).
A Trajectory reconstruction of all single cells throughout chemical reprogramming reveals three branches: pre-branch (before bifurcation), successful branch, and failed branch (after
bifurcation). Blue and red circles indicate cells of the successful and failed branches, respectively. B Heatmap showing the top 40 DEGs expression levels in successful branch and failed
branch cells. C Protein-protein interaction network of the top 40 DEGs in successful branch. D Heatmap showing the select genes expression dynamics during the cellular-state transition
process and expression dynamics. The successful and failed branches reprogramming trajectories (including pre-branch) are shown on the right and left, respectively.
This finding suggested that there was reconstruction of malignant tumour cells differentiation reprogramming trajectory during the development of retinoblastoma and UBE2C may be a newly
proposed oncogene with functions in tumorigenesis.
Indeed, UBE2C expression had already been shown to have the potentially ability to regression of tumours and was a reliable prognostic factor. However, few studies explored the role of the
UBE2C in retinoblastoma. The results clearly showed that UBE2C was remarkably increased in state-5, especially in retinoblastoma cells-c5 (Fig. 6A). To verify the clinical significance of
UBE2C, we collected a set of tumour tissues paired with normal tissue (GEO accession number: GSE111168). The bulk RNA-seq analysis revealed that all UBE2C transcripts were highly expressed
(Supplementary Fig. 6A). This finding strongly suggested that UBE2C amplification potentiates a progenitor-like proliferative state. To explore the prognostic role of UBE2C in
retinoblastoma, we then examined the expression of UBE2C in bulk tumours. As expected, UBE2C presented high expression in tumours and was higher in younger patients (