ROS-independent ER stress-mediated NRF2 activation promotes warburg effect to maintain stemness-associated properties of cancer-initiating cells
- Select a language for the TTS:
- UK English Female
- UK English Male
- US English Female
- US English Male
- Australian Female
- Australian Male
- Language selected: (auto detect) - EN
Play all audios:
Cancer-initiating cells (CICs) are responsible for tumor initiation, progression, and therapeutic resistance; moreover, redox homeostasis is important in regulating cancer stemness.
Previously, we have identified that cancer cells containing low intracellular reactive oxygen species levels (ROSLow cells) display enhanced features of CICs. However, the specific metabolic
signatures of CICs remain unclear and are required for further characterization by systemic screenings. Herein, we first showed CICs mainly relying on glycolysis that was important for the
maintenance of stemness properties. Next, we revealed that NRF2, a master regulator of antioxidants, was able to maintain low intracellular ROS levels of CICs, even though in the absence of
oxidative stress. We further characterized that NRF2 activation was required for the maintenance of CICs properties. Of ROSLow cells, NRF2 activation not only directly activates the
transcription of genes encoding glycolytic enzymes but also inhibited the conversion of pyruvate to acetyl-CoA by directly activating pyruvate dehydrogenase kinase 1 (PDK1) to lead to
inhibition of tricarboxylic acid (TCA) cycle; therefore, to promote Warburg effect. A positive regulatory ROS-independent ER stress pathway (GRP78/p-PERK/NRF2 signaling) was identified to
mediate the metabolic shift (Warburg effect) and stemness of CICs. Lastly, co-expression of p-PERK and p-NRF2 was significantly associated with the clinical outcome. Our data show that NRF2
acting as a central node in the maintenance of low ROS levels and stemness associated properties of the CICs, which is significantly associated with the clinical outcome, but independent
from ROS stress. Future treatments by inhibiting NRF2 activation may exhibit great potential in targeting CICs.
Cancer-initiating cells (CICs) exploit the characteristics of self-renewal and differentiation to drive tumor growth and progression1. Previously, we have enriched and identified head and
neck CICs (HN-CICs) through sphere culture2. Our most recent study shows that a subset of HN-CICs contains lower ROS levels. Consequently, the sorted ROSLow cells possess enhanced stemness
properties and tumorigenicity and acquire a quiescent state. Furthermore, compared with ROSLow cells, the other subset of HN-CICs with high ROS levels (the ROSHigh cells) are more
proliferative but exhibit the less self-renewal capacity3. Given the importance of redox homeostasis in regulating the stemness of CICs, we need to understand the unique physiology to
balance the ROS levels and stemness of CICs.
In various cancers, CICs are considered highly heterogeneous and harbor a distinct metabolic phenotype in terms of stemness features4. Of note, ROS is intimately tied to cellular metabolic
phenotype5. Additionally, mitochondria are the major source of ROS production through oxidative phosphorylation (OXPHOS)5. Interestingly, CICs have been described as preferentially relying
on the Warburg effect or OXPHOS in a cancer type-dependent manner6,7,8,9. Warburg effect not only provides sufficient energy demands but also minimizes ROS production in mitochondria8, 10.
Furthermore, we recently have demonstrated that ROSLow cells highly express the high-affinity glucose transporter, GLUT33. Indeed, metabolic reprogramming of cancer cells tightly regulates
defense against oxidative stress, thus promoting tumorigenesis and chemoresistance11.
From an initial screen of molecular mechanisms known to play a role in mediating CICs metabolism, we found a transcription factor NRF2 activity correlated with the Warburg effect (see the
following contexts). NRF2 is a master regulator of ROS-scavenging enzymes12. Indeed, NRF2 has been considered to regulate the self-renewal of various kinds of normal stem cells. A recent
study demonstrated that NRF2 is required for the switch to glycolysis by promoting HIFα activation in iPSC reprogramming13. Further, NRF2 has shown prognostic significance in many solid
tumors14, 15. Nevertheless, the mechanisms by which NRF2 controls cell metabolism that maintain redox homeostasis, and therefore sustains CICs properties, remain to be elucidated.
Furthermore, the molecular mechanisms by which NRF2 can be activated in CICs also remain elusive.
Our current study provides several insights into distinct subsets of cancer cells with different ROS levels, in which metabolic reprogramming and activation of NRF2 signaling are the main
mechanisms regulating cancer stemness.
Previously, we and others demonstrated that CICs, enriched within the sphere cells under serum-free culture conditions of cancer cells2, 16. To unravel the metabolic features of CICs, we
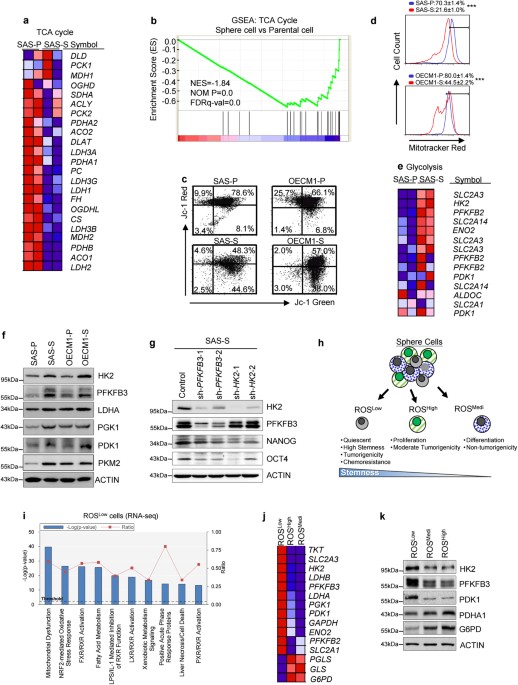
first investigated possible pathways of glucose metabolism in HN-CICs. Initially, the expression profile of TCA cycle-related genes in sphere cells (SAS-S) and in parental cells (SAS-P) was
analyzed by gene set enrichment analyses. Notably, TCA cycle-related genes were significantly downregulated in sphere cells (Figs. 1a, b). We further confirmed these results by measuring the
mitochondrial membrane potentials of the parental and sphere cells with JC-1 staining. Red JC-1 aggregates are typical of healthy mitochondria17. Indeed, the sphere cells had fewer red JC-1
aggregates than the parental cells that indicate the occurrence of mitochondrial depolarization within the sphere cells (Fig. 1c). In addition, we found an approximately 2–3 folds reduction
in the mitochondrial mass in sphere cells versus parental cells (Fig. 1d; SAS-P: 70.3% vs. SAS-S: 21.6%; OECM1-P: 80% vs. OECM1-S: 44.5%). Strikingly, the sphere cells displayed a higher
expression of glycolytic enzymes in order to promote glycolysis (Figs. 1e, f and Figure S1a,S1b). Given that radiation-resistant cells have been reported to have characteristics of cancer
stemness18, we set out to evaluate the correlation between glycolytic enzymes expression profile and radioresistance properties. Interestingly, expression of glycolytic enzymes was
significantly higher in radiation-resistant cells than in parental cells (Figure S1a). Next, we wanted to address whether genetically or pharmacologically inhibition of glycolysis would
abrogate the stemness properties of CICs. Genetic inhibition of HK2 or PFKFB3 by shRNAi, respectively, both reduced the expression of stemness markers (NANOG and OCT4) in SAS sphere cells
(Fig. 1g). Furthermore, pharmacologic inhibition of glycolysis by addition of 2-deoxyglucose (2-DG) showed the most significant effect on increasing cytotoxic effects and decreasing
expression of cancer stemness marker (OCT4 and CD44) in sphere cells (Figure S1c-S1e).
a Heatmap depicting expression of 24 genes encoding tricarboxylic acid (TCA) cycle pathway in parental (SAS-P) and sphere cells (SAS-S). b Gene Set Enrichment Analysis (GSEA) of a 24-gene
set comprising (TCA) cycle pathway in SAS-P versus SAS-S (NES normalized enrichment score; P = nominal P-value; FDR false discovery rate). c The mitochondrial membrane potentials (Δψ,
red/green ratios) of the parental and sphere cells were determined using JC-1 staining followed by FACS. (OECM1 parental (OECM1-P) and OECM1 sphere cells (OECM1-S)). d The mitochondrial
masses of the parental and sphere cells were determined using MitoTracker Red staining followed by FACS. e Heatmap depicting expression of genes encoding glycolytic pathway in parental and
sphere cells. f Immunoblots detecting the protein level of glycolytic enzymes in parental and sphere cells. g Immunoblots showing the expression level of HK2, PFKFB3, NANOG and OCT4 proteins
in control, sh-HK2 or sh-PFKFB3 sphere cells, respectively. h Schematic depicting features of ROSLow, ROSHigh, and ROSMedi cells. i Top 10 toxicology pathway lists identified in ROSLow
cells from RNA-Seq analysis. P-value, Fisher’s exact test. Threshold, the minimum significance level (−Log [P-value] as 1.25). Ratio, the molecules from the data set divided by the total
molecules that map to the toxicology pathway from within the IPA software. j Heatmap depicting expression of genes encoding glycolytic pathway in ROSLow, ROSMedi, and ROSHigh cells (P