Placental micrornas relate to early childhood growth trajectories
- Select a language for the TTS:
- UK English Female
- UK English Male
- US English Female
- US English Male
- Australian Female
- Australian Male
- Language selected: (auto detect) - EN
Play all audios:
ABSTRACT BACKGROUND Poor placental function is a common cause of intrauterine growth restriction, which in turn is associated with increased risks of adverse health outcomes. Our prior work
suggests that birthweight and childhood obesity-associated genetic variants functionally impact placental function and that placental microRNA are associated with birthweight. To address the
influence of the placenta beyond birth, we assessed the relationship between placental microRNAs and early childhood growth. METHODS Using the SITAR package, we generated two parameters
that describe individual weight trajectories of children (0–5 years) in the New Hampshire Birth Cohort Study (NHBCS, _n_ = 238). Using negative binomial generalized linear models, we
identified placental microRNAs that relate to growth parameters (FDR < 0.1), while accounting for sex, gestational age at birth, and maternal parity. RESULTS Genes targeted by the six
growth trajectory-associated microRNAs are enriched (FDR < 0.05) in growth factor signaling (TGF/beta: miR-876; EGF/R: miR-155, Let-7c; FGF/R: miR-155; IGF/R: Let-7c, miR-155), calmodulin
signaling (miR-216a), and NOTCH signaling (miR-629). CONCLUSIONS Growth-trajectory microRNAs target pathways affecting placental proliferation, differentiation and function. Our results
suggest a role for microRNAs in regulating placental cellular dynamics and supports the Developmental Origins of Health and Disease hypothesis that fetal environment can have impacts beyond
birth. IMPACT * We found that growth trajectory associated placenta microRNAs target genes involved in signaling pathways central to the formation, maintenance and function of placenta;
suggesting that placental cellular dynamics remain critical to infant growth to term and are under the control of microRNAs. * Our results contribute to the existing body of research
suggesting that the placenta plays a key role in programming health in the offspring. * This is the first study to relate molecular patterns in placenta, specifically microRNAs, to early
childhood growth trajectory. You have full access to this article via your institution. Download PDF SIMILAR CONTENT BEING VIEWED BY OTHERS GENETICALLY-PREDICTED PLACENTAL GENE EXPRESSION IS
ASSOCIATED WITH BIRTHWEIGHT AND ADULT BODY MASS INDEX Article Open access 06 January 2023 PLACENTAL GENOMICS MEDIATES GENETIC ASSOCIATIONS WITH COMPLEX HEALTH TRAITS AND DISEASE Article
Open access 04 February 2022 GENOME-WIDE ASSOCIATION STUDY OF PLACENTAL WEIGHT IDENTIFIES DISTINCT AND SHARED GENETIC INFLUENCES BETWEEN PLACENTAL AND FETAL GROWTH Article Open access 05
October 2023 INTRODUCTION The Developmental Origins of Health and Disease (DOHaD) posits that _in utero_ exposures can induce permanent maladaptive changes that “program” the fetus to have
increased risk of later-life diseases1. The placenta is the master regulator of the intrauterine environment and an ideal tissue in which to test the DOHaD paradigm. This ephemeral organ
facilitates the exchange of gases, nutrients and waste for the developing embryo2,3, in addition to aiding nutrient metabolism, and acting as an endocrine organ critical for early
development. Thus, its functions are responsible for proper development and programming of the offspring. MicroRNAs are 21–25 base pair non-coding RNAs that regulate gene expression
post-transcriptionally via sequence complementarity to the 3’ untranslated region of mRNA transcripts. microRNA-mediated gene regulation is achieved through target mRNA translational
inhibition or degradation4. MicroRNAs are proposed to regulate more than 50% of human genes4,5,6,7, emphasizing their dynamic utility as post-transcriptional regulators of gene expression.
Placental microRNAs shape placental development and function by targeting genes that regulate trophoblast proliferation and differentiation, apoptosis, invasion, cellular metabolism, as well
as vasculo- and angio-genesis7. In a study of placental microRNA sequencing data from more than 500 mother-infant pairs, in two independent cohorts, we have previously identified a group of
placental microRNAs that are associated with birthweight. The most robust birthweight differentially expressed microRNA, miR-532, was associated with the differential expression of
placental adipokines, leptin and adiponectin receptor8. The placental transcriptome may have lasting metabolic impact beyond birth. Using parallel genomic and transcriptomic data from the
Rhode Island Child Health Study (RICHS), Peng et al. reports that DNA variants that predict placental gene expression level (expression quantitative trait loci; eQTLs) for a given gene are
over-represented among loci that associate with childhood obesity and BMI9. Compared to eQTLs for seven adult tissues, placental eQTLs were most strongly enriched among results from
genome-wide association studies that link genomic loci to birthweight, childhood obesity, and childhood BMI. These results provide evidence for the ability of the placental transcriptional
landscape to have a lasting impact on early childhood growth and metabolism9. In this study, we pose the question: Do microRNAs that regulate the placental mRNAs have a lasting impact on
childhood growth? To address this question, we model childhood weight from birth to five years of age in the New Hampshire Birth Cohort Study (NHBCS). Using parameters derived from
individual growth curves, we relate placental microRNA expression, from small-RNA sequencing, with early childhood growth. We use in silico methods to predict mRNA targets of interesting
microRNAs and pathway analysis to add biological context to our findings. MATERIALS AND METHODS COHORT THE NEW HAMPSHIRE BIRTH COHORT STUDY NHBCS was initiated in 2009 and is an ongoing
study comprised of a cohort of mother-infant pairs (_N_ = 1971 as of 2021). Pregnant women between 18 and 45 years of age were recruited from the study’s participating prenatal care clinics
in New Hampshire. Women were included in the cohort if their primary source of drinking water was from an unregulated residential well, they had resided in the same household since their
last menstrual period and had no plans to move before delivery. All participants provided written informed consent in accordance with the requirements of the Committee for the Protection of
Human Subjects, the Institutional Review Board (IRB) of Dartmouth College. In this study, NHBCS participants were singleton pregnancies recruited between February 2012 and September 2013.
DATA COLLECTION ANTHROPOMORPHIC MEASURES NHBCS (_N_ = 1971 as of 2021) has parallel demographic and anthropomorphic measures for mothers and newborns, as well as placental microRNA
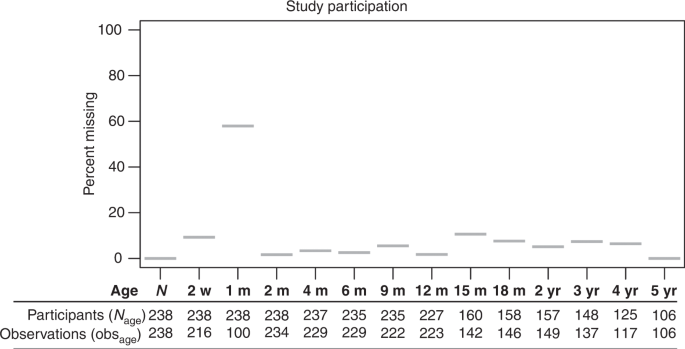
transcript abundance (_n_ = 322). Up to 14 weight measurements between birth and five years of age were abstracted from pediatric medical records (Ages: birth, 2 weeks, 1 month, 2 months, 4
months, 6 months, 9 months, 12 months, 15 months, 18 months, 2 years, 3 year, 4 years and 5 years; Fig. 1, _n_ = 317). Study participants were excluded from the analysis if they had less
than three separate weight observations, but were not excluded for intermediate missing observations, leaving 238 participants for growth trajectory analysis (Fig. 1). ADDITIONAL STUDY
COVARIATES Gestational age and fetal sex were abstracted from newborn medical records. _z_-Scores were calculated for gestational age. Self-reported maternal parity was collected by
questionnaire. TISSUE COLLECTION Fetal placental samples were collected at delivery; sections were obtained two centimeters (cm) from the umbilical cord and free of maternal decidua.
Collected tissue was immediately placed in RNA later solution (Life Technologies, Grand Island, NY) and stored at 4 °C for at least 72 h and stored at −80 °C. MICRORNA ISOLATION AND
SEQUENCING Total RNA was extracted from placenta using the Qiagen miRNeasy Mini Kit and a TissueLyser LT (Qiagen, Frederick, MD) following manufacturer’s protocol. Briefly, 25–35 mg of
placental tissue was placed in a 2 ml round bottom tube with 700 µl of Qiazol Lysing Reagent and one 5 mm stainless steel bead. The tissue was homogenized on the TissueLyser LT for 2 min at
40 Hz. The resulting homogenate was processed with the Qiagen miRNeasy Mini Kit and eluted in 30 µl RNase-free water. The RNA was quantitated on a NanoDrop 2000 (Thermo Fisher, Waltham, MA)
and quality checked on Agilent Bioanalyzer using the Agilent RNA 6000 Nano kit (Agilent, Santa Clara, CA). Single end, 1 × 75 bp next generation sequencing of placental microRNA was
performed by Qiagen Genomic Services (Frederick, Maryland). SMALLRNA-SEQ PROCESSING AND QUALITY CONTROL Raw FASTQ reads obtained from a total of 322 NHBCS samples were subject to adaptor
trimming with _cutadapt_ v1.1610. The 3’ adaptor sequence (AACTGTAGGCACCATCAAT) was trimmed based on vendor’s recommendation (Qiagen). After adaptor trimming, _fastQC_ v0.11.5 was used to
process the trimmed reads and QC results were aggregated using _MultiQC_ v1.5 for visualization11. One sample failed QC and was removed. Then we used trimmed reads and _miRDeep2_ to quantify
microRNA12. In short, _miRDeep2_ was used to first perform alignment using _bowtie1_ with human genome hg3813. The ‘Quantifier’ module in _miRDeep2_ was used to obtain raw counts of
microRNAs with _miRBase_ version 2214. SAMPLE FILTERING AND TRANSCRIPT FILTERING Raw counts were imported into _DESeq2_ for normalization and differential expression analysis. microRNAs with
less than one count per million in more than 10 percent of samples were removed. Samples from participants with less than three weight observations were removed from analysis, leaving 238
samples. Of the 2656 microRNA transcripts that mapped, 777 remained after filtering. NORMALIZATION Filtered microRNA raw counts were imported to DESeq2 for normalization and differential
expression analysis. For all data sets, parametric estimates of dispersion were calculated, and the median ratio method was used to estimate size factors for normalization for modeling with
_DESeq2_15. Normalized counts were exported from _DESeq2_ for surrogate variable analysis. RICHS RNAseq count data are available via dataverse (https://doi.org/10.15139/S3/FUC5EW) and the
methods for collection and processing are available elsewhere8. Library size normalized microRNA count observations among the most extreme 0.01% for each microRNA were flagged as count
outliers. We replaced flagged outlier microRNA observations with the mean normalized count for that microRNA across samples. Our treatment of outliers is similar to the method DESeq2
utilizes to replace outliers16. Among 184,926 individual observations, 185 were replaced. STATISTICAL ANALYSES MODELING CHILDHOOD GROWTH TRAJECTORY The R package SITAR was used to model
growth trajectory for all study participants with at least three weight observations (_n_ = 238)17. Individual children’s growth curves were visually assessed for outlier measures. Three
observations were removed (Fig. S1). The children’s weights were natural log transformed to meet the normality assumption of the SITAR method. Briefly, SITAR is a shape invariant model, with
individual random effects for each child, that estimates an average growth curve across samples. A set of three parameters are generated for each individual that, through translation
(vertical/horizontal shift) and rotation (counter/clockwise), transform the average growth curve to match each individual’s growth. The parameters, random effects, have mean zero and
standard deviations estimated from the data. These parameters - _size_, _intensity_ and _tempo_, are interpreted as percentiles relative to the average because the weights were natural log
transformed. The _size_ parameter represents average _size_ for any child relative to the average child and is graphically represented as a vertical shift of the weight curve (Fig. 2).
_Tempo_, the age at peak weight _intensity_, was not estimated for this analysis, since no measures were estimated around the peak of infant growth (6 weeks); _intensity_ is expressed as a
percentage deviation from mean intensity with higher values representing faster growth than average. Graphically, _intensity_ represents a rotation of the weight curve (Fig. 2). We modeled
the transformed weights using 10 degrees of freedom, and adjusted for child sex in the models that generated the _size_ and _intensity_ parameters. SURROGATE VARIABLE ANALYSIS To adjust for
batch effects, cell-type heterogeneity and other unknown sources of technical variation, we estimated a surrogate variable from the normalized transcript reads via the _svaseq_ function in
the _sva_ package that incorporates the Combat algorithm18,19. In the _svaseq_ function, the iteratively re-weighted least squares algorithm was used to estimate a surrogate variable based
on empirically-derived control transcripts. The full model (mod argument) used for _svaseq_ differed by application. The null model (mod0 argument) used all covariates except the outcomes
variables - _intensity_ and _size_. DIFFERENTIAL EXPRESSION ANALYSES microRNA transcript counts were modeled using a negative binomial generalized linear model with significance testing for
differentially expressed transcripts via Wald tests in _DESeq2_16. The microRNA transcripts were regressed on either the _size_ or _intensity_ parameters from SITAR. The _intensity_ analysis
included covariates for parity and gestational age (_z_-score). Three samples were missing information for parity and were removed from the _intensity_ analysis (_n_ = 235). The _size_
analysis included covariates for primigravida and maternal education (beyond high school). Five samples were missing information for the maternal education variable and were removed from the
_size_ analysis (_n_ = 230). One surrogate variable was also included as a covariate in both regression models (discussed in previous section). We considered microRNAs with a false
discovery rate less than 10% to be of interest and any with a false discovery rate less than 5% to be differentially expressed (DEmiR) with either _size_ or growth _intensity_. Plots of
normalized DEmiR counts vs either _intensity_ or _size_ were examined for outlier observations. SENSITIVITY ANALYSIS To assess potential confounding of DEmiR effects by pre-eclampsia,
maternal pre-pregnancy BMI, gestational weight gain or birthweight, potential confounders were individually added to the DEA model in DESeq2. Effect estimates and standard errors were
collected for _intensity_ and _size_ DEmiRs for comparison with original model statistics. TARGET MRNA PREDICTION Potential mRNA targets of significant microRNAs were identified from mirDIP
4.1.11.2, an online database of human microRNA-target predictions20. mirDIP integrates microRNA target predictions across 30 different resources, providing nearly 152 million human
microRNA-target predictions. Using the individual source ranking and confidence measures, mirDIP assigns a unified rank and confidence score using the quadratic function. For this analysis,
the predictions with the top 1% confidence scores (very high confidence) were returned for each microRNA20. The resulting microRNA-target mRNA pairs were carried forward in the analysis.
MICRORNA TARGET FILTERING Predicted microRNA-target mRNA pairs were excluded if the mRNAs were not expressed in placenta in the RICHS whole transcriptome data. PATHWAY ANALYSIS Pathway
over-representation analysis was conducted in consensuspathDB21, which aggregates data from 12 separate pathway analysis databases. For each pathway gene set, consensus path DB calculates a
_p_-value according to the hypergeometric test for the genes in both the putative target genes and the pathway gene set. All mRNAs not filtered for low reads in the RICHS whole transcriptome
dataset were included as the background, or null distribution, for the test. RESULTS This study analyzed data from children enrolled in the New Hampshire Birth Cohort Study (NHBCS).
Parallel placental microRNA transcript abundance was available for this cohort, as well as up to 14 weight measures between birth and 5 years, collected from well-child-checks. Study
participants were excluded from the analysis if they had less than three separate weight observations, but were not excluded for intermediate missing observations (Fig. 1). Observations as a
fraction of participants in the study at each measurement remained high throughout the study, despite attenuated participation with time, especially after one year (Fig. 1). 48% of
participants had at least 12 of the 14 potential observations and only 2% had less than 5 observations (median observations across participants is 11, ranged 3–14). Growth trajectory
modeling was performed for 238 NHBCS participants. GROWTH TRAJECTORY MODELING We modeled childhood weight growth trajectory using SuperImposition by Translation And Rotation (SITAR)17. SITAR
provided two parameters to describe each child’s growth. Both parameters are random effects with mean zero and standard deviation of one. The _size_ parameter is given as a percent,
relative to the fitted weight curve for all participants, for the average _size_ of each individual child. Higher _size_ is graphically represented as an upward vertical shift in a child’s
weight growth curve. The _size_ parameter in this analysis ranged between −37% and 31% (Fig. 2, red and blue lines). The _intensity_ parameter is expressed as a percentage deviation from the
mean _intensity_ for all participants, with higher values representing faster growth than average. Higher growth _intensity_ is graphically represented as a counterclockwise rotation in a
child’s weight growth curve. The _intensity_ parameter for this analysis ranged between −9% and 12% (Fig. 1, purple and cyan lines). Characteristics of the participants for this study are
shown in Table 1. Due to missingness in variables included in the models for the _intensity_ and _size_ differential gene expression analysis, three children were excluded in the _intensity_
analysis (_n_ = 235) and eight children were excluded in the _size_ analysis (_n_ = 230). The exclusion of children for the downstream analysis did not change the demographic distributions
for each analysis (data not shown). DIFFERENTIAL MICRORNA EXPRESSION ANALYSIS To analyze the associations between growth trajectory parameters and placental microRNA expression, we performed
differential expression analysis. For each growth trajectory parameter and microRNA transcript individually, transcript abundances were regressed on corresponding growth trajectory
parameter using _DESeq2_16. Covariates were included in the model if they were associated with the variable of interest (_intensity_ or _size_) in univariate regression analyses (Table 2).
For the _intensity_ analysis, models included maternal parity, gestational age (_z_-scores) and one surrogate variable (to account for batch effects, cell type heterogeneity, and other
sources of unknown variability). For the _size_ analysis, primigravida, maternal educational attainment and one surrogate variable were included in the models. Of the 777 microRNA
transcripts that passed quality control filtering for the analyses, three and one had FDR < 0.05 and 0.1 for the _intensity_ analysis (_p_-value < 3.8 × 10⁻⁴, Fig. 3, S2),
respectively. Two microRNAs in the _intensity_ analysis had _p_-values less than the Bonferroni family-wise error rate threshold (_p_-value < 6.4 × 10⁻⁵, Fig. 3, S2). In the _Size_
analysis, no microRNAs had FDR < 0.05, but two microRNAs had FDR < 0.1 (FDR = 0.054, _p_-value < 1.4 × 10⁻⁴). MicroRNAs that associate with _intensity_ are hsa-miR-155-5p (estimate
= 0.12; standard error: 0.02; FDR = 1.1 × 10⁻⁴), hsa-let-7c-5p (estimate = −0.03; standard error: 8 × 10⁻³; FDR = 0.01), and hsa-miR-629-3p (estimate = 0.05; standard error: 0.01; FDR =
0.04; Fig. 3). The _intensity_ DEmiRs have modest effects. hsa-miR-876-5p (estimate = −0.06; standard error: 0.02; FDR = 0.07) does not pass the FDR threshold for significance, but is
suggestive of an association with growth _intensity_. Although no microRNAs in the size analysis passed the FDR threshold for significance, hsa-miR-216a-5p (estimate = 0.61; standard error:
0.16; FDR = 0.054; Fig. 3) and hsa-let-7d-3p (estimate = −0.22; standard error: 0.06; FDR = 0.054; Fig. 3) are suggestive of an association between microRNA abundance and average _size_. The
estimates represent the log2 fold-change in microRNA abundance for one percent change in _intensity_ or _size_. Birthweight percentile was not included in the model because of its potential
involvement in the causal path of growth trajectory. Of the microRNAs that were associated with growth trajectory with an FDR < 0.1, three (miR-155, miR-629, and let-7c) were also
associated with birthweight (FDR < 0.1) in NHBCS8. Because only four participating mothers had pre-eclampsia, it was not included in the primary analysis. However, the potential for
pre-eclampsia and other potential confounders (pre-eclampsia, maternal pre-pregnancy BMI, gestational weight gain and birthweight) to attenuate significant associations (Fig. 3) between
placental microRNAs and growth trajectory parameters was assessed in sensitivity analyses (Fig. S3). As expected for a variable along the causal path, the inclusion of birthweight as a
covariate in the model strongly attenuated the estimated log2 fold change for _intensity_ among microRNAs that are also associated with birthweight. GROWTH TRAJECTORY DEMIR ASSOCIATED MRNAS
Bioinformatic targets of _Intensity-_ and _size-_ associated DEmiRs with an FDR < 0.1 were collected from the microRNA Data Integration Portal (mirDIP)20. In order to enrich our targets
with true microRNA-target pairs, we utilized total RNA abundance, assayed from 199 placentae using RNAseq in the RICHS cohort (https://doi.org/10.15139/S3/FUC5EW). mRNA transcripts were
considered putative targets of trajectory DEmiRs if they were detectable in RICHS placenta samples. Using these criteria, we found 1273 putative miR-155 targets, 1256 let-7c targets,
targets, 38 miR-629 targets, 168 miR-876 targets, 747 miR-216a targets, and 114 miR-let-7d targets. DEmiR mRNA targets were used in pathway analysis. For each DEmiR, putative target genes
were tested for pathway overrepresentation with consensuspathdb (CPDB), against all of the genes that passed QC in the RICHS whole transcriptome RNA-seq analysis21. The most significant
pathways are listed in Table 3. CPDB integrates pathways from 12 databases, meaning that similar results can be reported across sources. To further prioritize significantly overrepresented
pathways, we generated term frequency matrices for all pathway terms. To assess the microRNA target genes leading the enrichments, a second term frequency matrix was made from the microRNA
target genes present in the significant pathways. From these analyses, we found that FGFR1-4 and IGF/R signaling pathways were most frequent among significant miR-155 pathways. The most
frequent miR-155 target genes were PIK3CA and PIK3R1. EGF and EGFR pathways were the most frequent among let-7a significant pathways, with MAPK1, PIK3CA and PIK3R1 as the most frequent gene
targets. Among mir-629 pathways, PTEN was the most frequent pathway, with TNRC6C and AGO1 and AGO4 the most common gene targets. For miR-876-5p, a microRNA of interest in the _intensity_
analysis (FDR = 0.07) BMP, SMAD and TGF/beta signaling were the most frequent pathways, with SMAD2, TGFBR1 and ACVR1 and 2b the most frequent target genes. For interesting microRNA, miR-216a
(FDR = 0.054), regulation of MECP2 was most frequent among pathways, with miR-216a targets CALM1-3 as the most frequent genes. Let-7d-3p, which was identified as a microRNA of interest in
the _size_ analysis (FDR = 0.054), did not have targets enriched in any pathway. When targets of positively-associated growth _intensity_ DEmiRs (Fig. 3) were pooled for pathway analysis, we
found that the most frequent pathway terms were FGFR1-4 and the most frequent gene targets were PIK3CA and PIK3R1. DISCUSSION In this study, we have described the microRNAs from human
placenta that associate with growth trajectory from birth to five years old. We used a shape invariant model with random effects to generate two parameters that describe children’s growth
_intensity_ and average _size_ during the observation period. We found evidence of microRNAs that vary with both growth parameters (DEmiRs). We narrowed bioinformatically predicted microRNA
targets to only those in which the targeted mRNA was stably expressed in term placenta in the RICHS cohort. These putative DEmiR targets were used in pathway over-representation analysis.
Placental function, which underlies successful pregnancy and may have lasting influence, may be dictated by cellular dynamics – the balance of cell proliferation and differentiation among
the terminal placental trophoblast lineages22. Recent evidence has suggested that upstream progenitor cells, with the ability to differentiate into cytotrophoblasts, syncytiotrophoblasts and
extravillous trophoblasts are present in placenta at term23. Diminished abundance of these progenitor cells corresponds to placental dysfunction, like pre-eclampsia23. The formation of the
placenta relies on the maintenance and proliferation of human trophoblast stem cells, guided, in part by WNT and EGFR signaling24. In mice, this maintenance of stemness is reliant on the
presence of FGF signaling25, however, this may or may not be the case in human placentae24. IGF is also important for survival and proliferation of trophoblast stem cells22. In our analysis,
we see evidence that the EGFR (miR-155, let-7c), FGFR (miR155) and IGFR (let-7c, miR-155) signaling pathways are influenced by growth trajectory microRNAs (Fig. 4). Multipotent villous
cytotrophoblasts fuse to form the epithelial, multinucleated syncytiotrophoblast, which facilitates exchange of gases, nutrients and waste for the growing embryo, as well as acting as an
endocrine organ to balance the needs of the mother and fetus26. Syncytialization is mediated by cAMP and rising intracellular Ca+, as well as continued EGF signaling and Activin A24,27. In
this analysis, growth trajectory microRNAs are predicted to target calmodulin (miR-216a), EGFR (miR-155, let-7c) pathways, as well as Activin A (miR-876; Fig. 4). Cytotrophoblasts undergo a
process similar to the epithelial-to-mesenchymal transition to form the invasive extravillous trophoblast that connects the placenta with the maternal decidua and myometrium to establish
maternal blood supply26. Signaling through NOTCH1/2 and TGFβ family members (BMP2, Activins) mediate differentiation to the invasive extravillous cytotrophoblast28,29,30. The role of the
TFG-beta superfamily in trophoblast differentiation is complicated, as many of the pathway mechanisms overlap31, yet TGF-beta1/2/331 and NODAL32 inhibit the invasive phenotype and favor
syncytialization while BMP2 and Activin A/B/AB all favor the invasive phenotype28,29. In this analysis, we found evidence that growth trajectory associated microRNAs target components of the
NOTCH1/2 (miR-629) and TGFβ superfamily (miR-876) signaling cascades (Fig. 4). Although these processes described above were primarily described in first trimester placentae and cell
culture, the placental cytotrophoblasts continue to maintain the syncytiotrophoblast and extravillous trophoblasts to term23. The discovery of trophoblast progenitor cells in term placenta
suggests that some of the signaling pathways relevant in early gestation, remain important later in gestation. Within this assumption, our findings suggest a potential role for microRNAs to
influence the cellular dynamics of placenta at term, which in turn relates to the plasticity and efficiency of the placenta to support fetal growth23,33,34. This initial growth may prime the
neonate’s metabolism for early growth patterns35. However, it is also possible that some of the growth factors under microRNA influence have specific functions at term that are in addition
to or exclusive of their functions in early gestation. For instance, while EGF signaling guides trophoblast maintenance, proliferation and differentiation in early gestation, it may
stimulate the release of hormones to the maternal and fetal circulations at term22. Growth trajectory-associated microRNAs have also been associated with placental characteristics in other
studies. In cultured extravillous trophoblasts, miR-155 inhibits cell proliferation by down-regulating cyclin D1/p2736. In cultured cytotrophoblasts, Let-7c is associated with reduced
proliferation potential and syncytialization37,38. Let-7c is associated with the WNT/β-catenin signaling pathway in other progenitor cell types39. Our results suggest that placental
microRNAs effect signaling cascades central to trophoblast proliferation, differentiation and function. Most importantly, our results underscore the importance of placental function and the
intrauterine environment in establishing early growth trends. However, our findings should be interpreted within the context of this study’s limitations. This is an observational study in
which RNA was assayed from term placentae. We cannot conclude that our results are representative of microRNA associations throughout development. Further, we cannot establish that DEmiR
abundances directly cause differences in growth trajectory. We used DESeq2 to identify associations between microRNA expression and childhood growth, where childhood growth was determined
using child-specific estimates of _size_ and _intensity_ derived using SITAR. In DESeq2, microRNA abundances (dependent variable) are regressed on _size_ or _intensity_ (independent
variable), allowing us to examine the association of early childhood growth on placental microRNA expression. Although the models employed in DESeq2 are temporally reversed in terms of what
is being modeled as dependent and independent variables, DESeq2 represents the best choice for modeling gene expression data as it accounts for the over-dispersion of RNA-sequencing count
data. While the estimates generated by these models may be less intuitive and temporally reversed from our hypothesis, the associations between placental microRNA expression with growth
trajectory patterns ascertained using such models are nevertheless valid. We adjusted for likely confounders in our study, but cannot rule out the possibility that unmeasured or residual
confounding remains in our analysis. Potential confounders are maternal BMI, gestational weight gain and pre-eclampsia. Sensitivity analysis suggests that the addition of these variables to
our models would have little to no effect on our conclusions, though some of our top findings are sensitive to one or both. To limit unknown statistical confounding (e.g. differing cellular
composition between individuals or population stratification), our models are adjusted using surrogate variable analysis. This is a data-driven approach that may incorrectly estimate
confounding elements, adding variability to our model. Recent research indicates that SVA is one of the more robust and reliable methods in studies such as ours40. Lastly, the cohort
utilized in this study consisted predominantly of healthy white mothers from a rural New England region of the United States, potentially limiting the generalizability of our findings. To
our knowledge, this is the first study to examine the relationships between human placental microRNAs and early childhood growth trajectory. In this analysis, we found that growth trajectory
associated placenta microRNAs target genes involved in signaling pathways central to the formation, maintenance and function of placenta. These results suggest that placental cellular
dynamics remain critical to infant growth _to term_ and are under the control of microRNAs. Our results contribute to the existing body of research suggesting that the placenta plays a key
role in programming health in the offspring. DATA AVAILABILITY RICHS total RNA-seq raw reads have been deposited at the NCBI database of Genotypes and Phenotypes (dbGaP) (phs001586). RICHS
and NHBCS microRNA count matrices (https://doi.org/10.15139/S3/FUC5EW) and covariate data (https://doi.org/10.15139/S3/O9KYGB) are available at Dataverse. REFERENCES * Barker, D. J. P. &
Thornburg, K. L. Placental programming of chronic diseases, cancer and lifespan: a review. _Placenta_ 34, 841–845 (2013). Article CAS PubMed Google Scholar * Red-Horse, K. et al.
Trophoblast differentiation during embryo implantation and formation of the maternal-fetal interface. _J. Clin. Invest._ 114, 744–754 (2004). Article CAS PubMed PubMed Central Google
Scholar * Kaufmann, P., Mayhew, T. M. & Charnock-Jones, D. S. Aspects of human fetoplacental vasculogenesis and angiogenesis. II. Changes during normal pregnancy. _Placenta_ 25, 114–126
(2004). Article CAS PubMed Google Scholar * Bartel, D. P. Metazoan MicroRNAs. _Cell_ 173, 20–51 (2018). Article CAS PubMed PubMed Central Google Scholar * Quévillon Huberdeau, M.
& Simard, M. J. A guide to microRNA-mediated gene silencing. _FEBS J._ 286, 642–652 (2019). Article PubMed Google Scholar * Pasquinelli, A. E. MicroRNAs and their targets:
recognition, regulation and an emerging reciprocal relationship. _Nat. Rev. Genet._ 13, 271–282 (2012). Article CAS PubMed Google Scholar * Hayder, H., O’Brien, J., Nadeem, U. &
Peng, C. MicroRNAs: crucial regulators of placental development. _Reproduction_ 155, R259–R271 (2018). Article CAS PubMed Google Scholar * Kennedy, E. M. et al. Placental microRNA
expression associates with birthweight through control of adipokines: results from two independent cohorts. _Epigenetics_ 16, 770–782 (2021). * Peng, S. et al. Genetic regulation of the
placental transcriptome underlies birth weight and risk of childhood obesity. _PLoS Genet_. 14, e1007799 (2018). * Martin, M. Cutadapt removes adapter sequences from high-throughput
sequencing reads. _EMBnet. J._ 17, 10–12 (2011). Article Google Scholar * Ewels, P., Magnusson, M., Lundin, S. & Käller, M. MultiQC: summarize analysis results for multiple tools and
samples in a single report. _Bioinforma. Oxf. Engl._ 32, 3047–3048 (2016). Article CAS Google Scholar * Friedländer, M. R., Mackowiak, S. D., Li, N., Chen, W. & Rajewsky, N. miRDeep2
accurately identifies known and hundreds of novel microRNA genes in seven animal clades. _Nucleic Acids Res._ 40, 37–52 (2012). Article PubMed Google Scholar * Langmead, B., Trapnell, C.,
Pop, M. & Salzberg, S. L. Ultrafast and memory-efficient alignment of short DNA sequences to the human genome. _Genome Biol._ 10, R25 (2009). Article PubMed PubMed Central Google
Scholar * Griffiths-Jones, S., Saini, H. K., van Dongen, S. & Enright, A. J. miRBase: tools for microRNA genomics. _Nucleic Acids Res._ 36, D154–D158 (2008). Article CAS PubMed
Google Scholar * Anders, S. & Huber, W. Differential expression analysis for sequence count data. _Genome Biol._ 11, R106 (2010). Article CAS PubMed PubMed Central Google Scholar *
Love, M. I., Huber, W. & Anders, S. Moderated estimation of fold change and dispersion for RNA-seq data with DESeq2. _Genome Biol_. 15, 550 (2014). * Cole, T. J., Donaldson, M. D. C.
& Ben-Shlomo, Y. SITAR—a useful instrument for growth curve analysis. _Int. J. Epidemiol._ 39, 1558–1566 (2010). Article PubMed PubMed Central Google Scholar * Leek, J. T., Johnson,
W. E., Parker, H. S., Jaffe, A. E. & Storey, J. D. The sva package for removing batch effects and other unwanted variation in high-throughput experiments. _Bioinforma. Oxf. Engl._ 28,
882–883 (2012). Article CAS Google Scholar * Leek, J. T. svaseq: removing batch effects and other unwanted noise from sequencing data. _Nucleic Acids Res._ 42, e161 (2014). Article
PubMed PubMed Central Google Scholar * Tokar, T. et al. mirDIP 4.1—integrative database of human microRNA target predictions. _Nucleic Acids Res._ 46, D360–D370 (2018). Article CAS
PubMed Google Scholar * Kamburov, A. et al. ConsensusPathDB: toward a more complete picture of cell biology. _Nucleic Acids Res._ 39, D712–D717 (2011). Article CAS PubMed Google Scholar
* Aplin, J. D. & Jones, C. J. P. Cell dynamics in human villous trophoblast. _Hum. Reprod. Update_ 27, 904–922 (2021). Article CAS PubMed Google Scholar * Gamage, T. K. et al.
Side-population trophoblasts exhibit the differentiation potential of a trophoblast stem cell population, persist to term, and are reduced in fetal growth restriction. _Stem Cell Rev. Rep._
16, 764–775 (2020). Article CAS PubMed Google Scholar * Okae, H. et al. Derivation of human trophoblast stem cells. _Cell Stem Cell_ 22, 50–63.e6 (2018). Article CAS PubMed Google
Scholar * Latos, P. A. & Hemberger, M. From the stem of the placental tree: trophoblast stem cells and their progeny. _Development_ 143, 3650–3660 (2016). Article CAS PubMed Google
Scholar * Knöfler, M. et al. Human placenta and trophoblast development: key molecular mechanisms and model systems. _Cell. Mol. Life Sci._ 76, 3479–3496 (2019). Article PubMed PubMed
Central Google Scholar * Gupta, S. K., Malhotra, S. S., Malik, A., Verma, S. & Chaudhary, P. Cell signaling pathways involved during invasion and syncytialization of trophoblast cells.
_Am. J. Reprod. Immunol._ 75, 361–371 (2016). Article PubMed Google Scholar * Zhao, H.-J. et al. Bone morphogenetic protein 2 promotes human trophoblast cell invasion by upregulating
N-cadherin via non-canonical SMAD2/3 signaling. _Cell Death Dis._ 9, 1–12 (2018). Article Google Scholar * Zhao, H.-J. et al. Bone morphogenetic protein 2 promotes human trophoblast cell
invasion by inducing activin A production. _Endocrinology_ 159, 2815–2825 (2018). Article CAS PubMed Google Scholar * Haider, S. et al. Notch1 controls development of the extravillous
trophoblast lineage in the human placenta. _Proc. Natl Acad. Sci. U. S. A._ 113, E7710–E7719 (2016). Article CAS PubMed PubMed Central Google Scholar * Li, Y., Yan, J., Chang, H.-M.,
Chen, Z.-J. & Leung, P. C. K. Roles of TGF-β superfamily proteins in extravillous trophoblast invasion. _Trends Endocrinol. Metab._ 32, 170–189 (2021). Article CAS PubMed Google
Scholar * Nadeem, L. et al. Nodal signals through activin receptor-like kinase 7 to inhibit trophoblast migration and invasion: implication in the pathogenesis of preeclampsia. _Am. J.
Pathol._ 178, 1177–1189 (2011). Article CAS PubMed PubMed Central Google Scholar * Myatt, L. Placental adaptive responses and fetal programming. _J. Physiol._ 572, 25–30 (2006). Article
CAS PubMed PubMed Central Google Scholar * Soares, M. J., Chakraborty, D., Kubota, K., Renaud, S. J. & Rumi, M. A. K. Adaptive mechanisms controlling uterine spiral artery
remodeling during the establishment of pregnancy. _Int. J. Dev. Biol._ 58, 247–259 (2014). Article PubMed PubMed Central Google Scholar * Karachaliou, M. et al. Association of
trimester-specific gestational weight gain with fetal growth, offspring obesity, and cardiometabolic traits in early childhood. _Am. J. Obstet. Gynecol._ 212, 502.e1–502.e14 (2015). Article
PubMed Google Scholar * Dai, Y. et al. MicroRNA-155 inhibits proliferation and migration of human extravillous trophoblast derived HTR-8/SVneo cells via down-regulating cyclin D1.
_Placenta_ 33, 824–829 (2012). Article CAS PubMed Google Scholar * Ali, A., Bouma, G. J., Anthony, R. V. & Winger, Q. A. The role of LIN28-let-7-ARID3B pathway in placental
development. _Int. J. Mol. Sci._ 21, 3637 (2020). Article CAS PubMed PubMed Central Google Scholar * McWhorter, E. S. et al. LIN28B regulates androgen receptor in human trophoblast
cells through Let-7c. _Mol. Reprod. Dev._ 86, 1086–1093 (2019). Article CAS PubMed PubMed Central Google Scholar * Modi, B. P. et al. Expression patterns of the chromosome 21 MicroRNA
cluster (miR-99a, miR-125b and let-7c) in chorioamniotic membranes. _Placenta_ 49, 1–9 (2017). Article CAS PubMed Google Scholar * van Rooij, J. et al. Evaluation of commonly used
analysis strategies for epigenome- and transcriptome-wide association studies through replication of large-scale population studies. _Genome Biol._ 20, 235 (2019). Article PubMed PubMed
Central Google Scholar Download references FUNDING This work was supported by the National Institutes of Health (NIEHS R24ES028507, R01ES025145, P30ES019776, NIMHD R01MD011698 and NICHD
K99HD104991). AUTHOR INFORMATION AUTHORS AND AFFILIATIONS * Gangarosa Department of Environmental Health, Rollins School of Public Health, Emory University, Atlanta, Georgia Elizabeth M.
Kennedy, Karen Hermetz, Amber Burt & Carmen J. Marsit * Department of Biostatistics & Data Science, University of Kansas Medical Center, Kansas City, KS, USA Dong Pei & Devin C.
Koestler * Department of Genetics and Genome Sciences, Icahn School of Medicine at Mount Sinai, New York, NY, USA Ke Hao * Department of Environmental Medicine and Public Health, Icahn
School of Medicine at Mount Sinai, New York, NY, USA Jia Chen * Department of Epidemiology, Geisel School of Medicine, Dartmouth College, Lebanon, Hanover, NH, USA Diane Gilbert-Diamond
& Margaret R. Karagas * Hubert Department of Global Health, Rollins School of Public Health, Emory University, Atlanta, Georgia Usha Ramakrishnan * Children’s Environmental Health and
Disease Prevention Research Center at Dartmouth, Dartmouth College, Lebanon, Hanover, NH, USA Margaret R. Karagas Authors * Elizabeth M. Kennedy View author publications You can also search
for this author inPubMed Google Scholar * Karen Hermetz View author publications You can also search for this author inPubMed Google Scholar * Amber Burt View author publications You can
also search for this author inPubMed Google Scholar * Dong Pei View author publications You can also search for this author inPubMed Google Scholar * Devin C. Koestler View author
publications You can also search for this author inPubMed Google Scholar * Ke Hao View author publications You can also search for this author inPubMed Google Scholar * Jia Chen View author
publications You can also search for this author inPubMed Google Scholar * Diane Gilbert-Diamond View author publications You can also search for this author inPubMed Google Scholar * Usha
Ramakrishnan View author publications You can also search for this author inPubMed Google Scholar * Margaret R. Karagas View author publications You can also search for this author inPubMed
Google Scholar * Carmen J. Marsit View author publications You can also search for this author inPubMed Google Scholar CONTRIBUTIONS E.M.K., D.C.K., K.H., J.C., D.G.-D., M.R.K. and C.J.M.
conceptualized and designed the study. K.H., A.B. and D.P. acquired data. E.M.K. analyzed and interpreted the data. E.M.K. Drafted the article. K.H., A.B., D.P., D.C.K., K.H., J.C., D.G.-D.,
U.R., M.R.K. and C.J.M. critically reviewed and carefully revised the article. All authors approved of the version to be published. CORRESPONDING AUTHOR Correspondence to Carmen J. Marsit.
ETHICS DECLARATIONS COMPETING INTEREST The authors declare no competing interests. ETHICS APPROVAL AND CONSENT TO PARTICIPATE All participants provided written, informed consent and all
protocols were approved by the IRBs at the Women & Infants Hospital of Rhode Island, Dartmouth College and Emory University, respectively. ADDITIONAL INFORMATION PUBLISHER’S NOTE
Springer Nature remains neutral with regard to jurisdictional claims in published maps and institutional affiliations. SUPPLEMENTARY INFORMATION SUPPLEMENTAL FIGURES RIGHTS AND PERMISSIONS
Springer Nature or its licensor (e.g. a society or other partner) holds exclusive rights to this article under a publishing agreement with the author(s) or other rightsholder(s); author
self-archiving of the accepted manuscript version of this article is solely governed by the terms of such publishing agreement and applicable law. Reprints and permissions ABOUT THIS ARTICLE
CITE THIS ARTICLE Kennedy, E.M., Hermetz, K., Burt, A. _et al._ Placental microRNAs relate to early childhood growth trajectories. _Pediatr Res_ 94, 341–348 (2023).
https://doi.org/10.1038/s41390-022-02386-0 Download citation * Received: 16 February 2022 * Revised: 19 October 2022 * Accepted: 26 October 2022 * Published: 15 November 2022 * Issue Date:
July 2023 * DOI: https://doi.org/10.1038/s41390-022-02386-0 SHARE THIS ARTICLE Anyone you share the following link with will be able to read this content: Get shareable link Sorry, a
shareable link is not currently available for this article. Copy to clipboard Provided by the Springer Nature SharedIt content-sharing initiative