Sorcin can trigger pancreatic cancer-associated new-onset diabetes through the secretion of inflammatory cytokines such as serpin E1 and CCL5
- Select a language for the TTS:
- UK English Female
- UK English Male
- US English Female
- US English Male
- Australian Female
- Australian Male
- Language selected: (auto detect) - EN
Play all audios:
A rise in blood glucose is an early warning sign of underlying pancreatic cancer (PC) and may be an indicator of genetic events in PC progression. However, there is still a lack of
mechanistic research on pancreatic cancer-associated new-onset diabetes (PCAND). In the present study, we identified a gene SRI, which possesses a SNP with the potential to distinguish PCAND
and Type 2 diabetes mellitus (T2DM), by machine learning on the basis of the UK Biobank database. In vitro and in vivo, sorcin overexpression induced pancreatic β-cell dysfunction. Sorcin
can form a positive feedback loop with STAT3 to increase the transcription of serpin E1 and CCL5, which may directly induce β-cell dysfunction. In 88 biopsies, the expression of sorcin was
elevated in PC tissues, especially in PCAND samples. Furthermore, plasma serpin E1 levels are higher in peripheral blood samples from PCAND patients than in those from T2DM patients. In
conclusion, sorcin may be the key driver in PCAND, and further study on the sorcin-STAT3-serpin E1/CCL5 signaling axis may help us better understand the pathogenesis of PCAND and identify
potential biomarkers.
Pancreatic cancer (PC) is a highly fatal disease with a 5-year cumulative survival rate of approximately 10% in the USA1,2. Early diagnosis of PC at a resectable stage provides more
treatment options and substantially improves patient survival3. Previous studies of pancreatic tumorigenesis have suggested that mutations in PC driver genes occur in a specific order;
activating mutations in KRAS are present in low-grade pancreatic intraepithelial neoplasia (PanIN-1) lesions4 (94.1% mutation rate5), and inactivating mutations in CDKN2A (17.0%), TP53
(63.9%) and SMAD4 (20.8%) occur thereafter and are found in transformed PanIN-2 and PanIN-3 lesions6,7. However, owing to the long duration PanIN-PC evolution and the lack of specific marker
gene mutations8, related early diagnostic strategies have not achieved significant clinical benefits.
New-onset diabetes, especially in individuals aged over 50 years, has been identified as an early warning sign of underlying PC. A case‒control study revealed that, on average, patients with
pancreatic ductal adenocarcinoma (PDAC) develop hyperglycemia 36 to 30 months before their tumor diagnosis9, presenting a potential window of opportunity for early detection. Distinguishing
new-onset diabetes from the more prevalent type 2 diabetes mellitus (T2DM) is a prerequisite for targeted screening of this high-risk population. A recent study by Bao et al. suggested that
pancreatic cancer-associated new-onset diabetes (PCAND) is characterized primarily by reduced insulin secretory capacity resulting from β-cell dysfunction10. Insulin resistance, though also
present in PCAND patients11, appears to be less severe than that observed in patients with T2DM10. Recent studies have also identified a growing list of biomarkers associated with PCAND,
including connexin-2612, vanin-1 (VNN-1) and matrix metalloproteinase 9 (MMP-9)13,14, galectin-3 and S100A915, S-100A8 N-terminal peptide16, amylin17, the glucagon/insulin ratio18, insulin
gene promoter polymorphisms19, adrenomedullin20, islet amyloid polypeptide (IAPP)21, fatty acid binding protein-1 (FABP-1)22 and insulin-like growth factor-I23. However, the mechanistic link
between PC and the pathogenesis of new-onset diabetes remains largely unclear. The main challenge now is identifying the 1% of PCAND patients from common T2DM patients in the new-onset
diabetes population24,25,26.
To identify the key regulator(s) involved in PCAND pathogenesis, we employed machine learning techniques to identify single nucleotide polymorphism (SNP) loci and their associated genes that
possess discriminatory power in distinguishing between PCAND and T2DM. Finally, we identified SRI gene, which encodes a protein named sorcin (soluble resistance-related calcium binding
protein)27. Interestingly, we found that sorcin was significantly overexpressed in tumor samples from PDAC patients, especially in PCAND patients. In vitro and in vivo, we found that sorcin
overexpression can impair pancreatic β-cells. We showed that sorcin forms a positive feedback loop with STAT3 and activates the transcription of inflammatory factors, such as CCL5 and serpin
E1. Finally, we preliminarily confirmed the potential of SRI and its downstream serpin E1 in distinguishing PCAND from T2DM on the basis of an online database and small clinical cohorts.
The UK Biobank is an ongoing project to demonstrate the successful collection and sharing of linked genetic, physical and clinical information at the population scale. Extensive genetic and
clinical data have been collected for approximately 500,000 volunteers across the United Kingdom28. We identified patients with cancer using the International Classification of Diseases
codes (version 10, ICD-10) that were recorded in the national cancer registry on the basis of hospital admissions and causes of death. T2DM cases were defined as having an ICD-10 code of
E11.X. Only cases in which the individuals did not have T2DM or cancer at the date of the attending assessment center were included in this research and subsequently followed up for incident
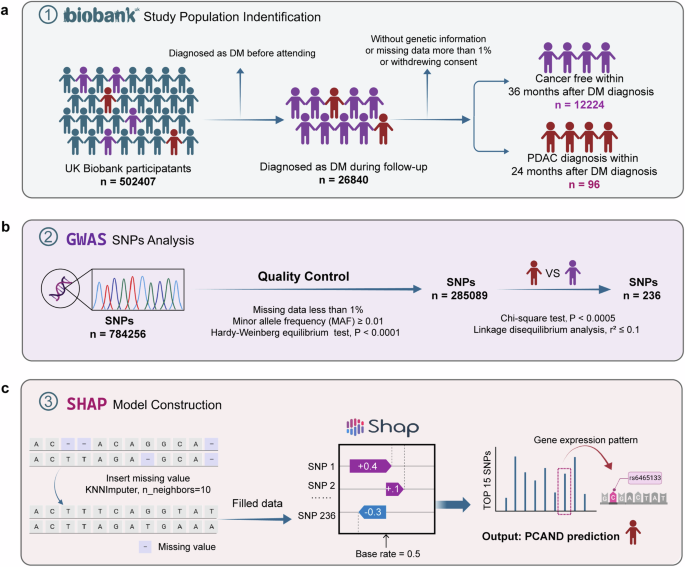
T2DM and PDAC events. The participants were then split into groups according to the following criteria: PCAND if diagnosed with PDAC within 24 months after the diagnosis of T2DM and T2DM if
no cancer occurred during the follow-up, which was longer than 36 months after the diagnosis of T2DM. The specific study screening flow chart is presented in Fig. 1a. The current research
was conducted via the UK Biobank Resource under Application 91799.
a The procedure of population screening and partitioning into PCAND and pure T2DM cohorts in the UK Biobank. b The procedure of GWAS analysis. The quality of the genetic data was controlled
by the Hardy‒Weinberg equilibrium (HWE) test (P values less than 0.0001). SNP loci with a P value