Cadherin-5: a biomarker for metastatic breast cancer with optimum efficacy in oestrogen receptor-positive breast cancers with vascular invasion
- Select a language for the TTS:
- UK English Female
- UK English Male
- US English Female
- US English Male
- Australian Female
- Australian Male
- Language selected: (auto detect) - EN
Play all audios:
A glycoproteomic study has previously shown cadherin-5 (CDH5) to be a serological marker of metastatic breast cancer when both protein levels and glycosylation status were assessed. In this
study we aimed to further validate the utility of CDH5 as a biomarker for breast cancer progression.
A nested case–control study of serum samples from breast cancer patients, of which n=52 had developed a distant metastatic recurrence within 5 years post-diagnosis and n=60 had remained
recurrence-free. ELISAs were used to quantify patient serum CDH5 levels and assess glycosylation by Helix pomatia agglutinin (HPA) binding. Clinicopathological, treatment and lifestyle
factors associated with metastasis and elevated biomarker levels were identified.
Elevated CDH5 levels (P=0.028) and ratios of CDH5:HPA binding (P=0.007) distinguished patients with metastatic disease from those that remained metastasis-free. Multivariate analysis showed
that the association between CDH5:HPA ratio and the formation of distant metastases was driven by patients with oestrogen receptor (ER+) positive cancer with vascular invasion (VI+).
CDH5 levels and the CDH5 glycosylation represent biomarker tests that distinguish patients with metastatic breast cancer from those that remain metastasis-free. The test reached optimal
sensitivity and specificity in ER-positive cancers with vascular invasion.
Serum tumour markers are economic, non-invasive tests that can be used to aid diagnosis, to monitor disease progression and patient response to treatment. In order for oncologists to tailor
individual treatment strategies, breast cancer patients with the highest risk of developing metastatic disease need to be classified to identify those most likely to benefit from adjuvant
therapy, whilst minimising the number of women receiving unnecessary therapies. Two of the most widely utilised breast cancer biomarkers are cancer antigen 15.3 (CA15.3) and carcinoembryonic
antigen (CEA), measured after primary breast cancer treatment for the detection of recurrent disease or metastasis (Sturgeon et al, 2008, 2009). However, the most appropriate use of tumour
markers for monitoring breast cancer progression remains the subject of considerable debate in the scientific community (Mirabelli and Incoronato, 2013). Recently, new imaging techniques
have been allied with serum tumour marker measurements to identify cancerous lesions non-detectable by conventional imaging modalities, for example, positron emission tomography imaging has
been shown to detect breast cancer recurrence and metastasis in patients with rising levels of tumour markers such as CA15.3 (Champion et al, 2011; Katayama et al, 2012). This provides a
renewed impetus in the search for serum markers for breast cancer which may allay the criticism current markers have attracted, whilst increasing the diagnostic ability of imaging
techniques.
Many serological cancer biomarkers are glycoproteins. Glycosylation is one of the most frequent post translational modifications to occur on proteins (Khoury et al, 2011), but in the
majority of diagnostic tests protein levels are monitored whilst the glycan moiety, and therefore biological information possibly pertaining to pathology, is ignored. As aberrant
glycosylation is known to accompany malignant transformation, this offers potential for refinement of cancer serum biomarker tests (Kuzmanov et al, 2013). In an attempt to address the
under-exploitation of glycosylation for breast cancer biomarker discovery, we previously employed a glycoproteomic approach and reported many serum proteins with altered glycosylation in
metastatic breast cancer. Using this approach, cadherin-5 (CDH5) emerged as a novel biomarker for metastatic breast cancer (Fry et al, 2013), when assessed by ELISAs that incorporate
measurements of glycosylation status, evaluated by binding of the lectin Helix pomatia agglutinin (HPA) known to detect poor prognosis metastatic cancer (Schumacher and Adam, 1997; Mitchell
and Schumacher, 1999; Dwek et al, 2001).
In this study we aimed to further determine the utility of CDH5 as a biomarker for breast cancer progression by identifying clinicopathological, treatment and lifestyle factors associated
with metastasis and elevated biomarker levels. Serum samples from breast cancer patients were analysed to obtain measurements of CDH5 and to determine the glycosylation status as monitored
by HPA binding. The CDH5:HPA test emerged as a novel means for detection of metastatic breast cancer in patients with ER-positive tumours that have infiltrated the vasculature.
Serum samples were routinely collected as part of the DietCompLyf study (Swann et al, 2013) approved by the UCL/UCLH Committees on the Ethics of Human Research (ref. 96/3433 and 98/0090).
All patients consented to participation in the study. n=2808 breast cancer patients were recruited onto the study (new protocol) 9–15 months post breast cancer diagnosis, whereupon the first
of five annual venipunctures was performed and blood was collected into 6 ml vacutainers (BD Bioscience, Plymouth, UK), left to stand for 1 h to clot, centrifuged at 1200 g for 15 min and
the resulting supernatant aliquoted into 0.5 ml fractions and frozen at −20 °C or −70 °C. Patients (n=207) developed distant metastases by October 2012, of which n=120 had available serum
samples from year 1 and at least one other year of the DietCompLyf study. Serum samples were analysed from 2 patient groups; those with no sign of distant metastatic recurrence (NSR) 48
months (±3 months) post recruitment (60 months ±3 months post-diagnosis), and those with distant metastatic recurrence (REC) within the same time period. NSR and REC patient groups were
selected according to their age at diagnosis, tumour size, grade, lymph node, oestrogen receptor, progesterone receptor and human epidermal growth factor receptor 2 statuses, Table 1.
The CDH5 levels recorded previously (Fry et al, 2013) for patients with either NSR (m1) or REC (m2) were used to estimate the sample size required in each group using the following equation:
n=2 × (sd)2 × (zα+zβ)2/(m1−m2)2 using multipliers based on significance level (zα) and power (zβ; Suresh and Chandrashekara, 2012). This identified a sample size of 92 samples per group to
achieve 95% significance and 90% power. After analysis of n=60 NSR and n=52 REC samples, statistical significance was reached for the CDH5 ELISAs and to preserve the DietCompLyf sample bank
no further serum testing was performed.
Ninety-six-well plates (Immuno Maxisorp, Thermo Scientific, Loughborough, UK) were coated with 50 μl mouse monoclonal anti-human CDH5 (MM0012-8A03, Insight Biotechnology, Middlesex, UK)
diluted to 0.2 μg ml−1 in carbonate/bicarbonate buffer, pH 9.6, by overnight incubation at 4 °C. All subsequent steps were undertaken at room temperature on an orbital shaker. Wells were
washed five times with 200 μl phosphate-buffered saline/0.1% (v/v) Tween 20 (PBS/T), blocked by addition of 200 μl Carbofree Solution (Vector Labs, Peterborough, UK) for 30 min and then
washed a further five times with 200 μl PBS/T. Patient sera were diluted 1 in 50 and 1 in 250 in PBS. 25 μl of each dilution was added to wells in duplicate followed by addition of 50 μl
Carbofree solution to each well. Plates were incubated for 2 h, washed five times with 200 μl PBS/T, and then 50 μl of biotinylated goat polyclonal anti-human CDH5 (N-14, Insight
Biotechnology) prepared at 0.5 μg ml−1 in Carbofree solution was added for 1 h. Wells were washed four times with 200 μl PBS/T and 50 μl of streptavidin conjugated to poly-horse radish
peroxidase (Thermo Scientific) diluted 1 : 4000 in Carbofree Solution was added for 1 h. Wells were washed three times with 200 μl PBS/T followed by a further three times with deionised
water before addition of 100 μl 3,3′,5,5′-tetramethylbenzidine (TMB) microwell peroxidase substrate (Insight Biotechnology). The reaction was monitored using a Dynatech MRX plate reader
(Dynatech Medical Products, Alexandria, VA, USA) and quenched by addition of 100 μl 1 M phosphoric acid when the absorbance measured at 630 nm reached ∼0.6 absorbance units. Following
quenching the absorbance was read at 450 nm in a Wallac 1420 Victor 2 plate reader (Perkin Elmer, Beaconsfield, UK).
Ninety-six-well plates were coated, incubated and then washed as described in the previous section. Seventy-five microlitre of cold 20 mM periodic acid was added to each well for 30 min at 4
°C. Following five washes with 200 μl PBS/T plates were blocked and washed as before. Patient serum was diluted 1 in 25 and 1 in 125 in PBS. Twenty-five microlitre of each dilution was
added to wells in duplicate, before addition of 50 μl Carbofree solution to each well. Plates were incubated for 2 h, washed five times with 200 μl PBS/T, and then 50 μl of biotinylated HPA
(Sigma Aldrich, Dorset, UK) at 10 μg ml−1 in Carbofree solution was added for 1 h. Wells were washed as before and 50 μl of streptavidin conjugated to poly-horse radish peroxidase diluted 1
: 1000 in Carbofree solution was added for 1 h. Wells were washed three times with 200 μl PBS/T followed by a further three times with deionised water before addition of 100 μl TMB microwell
peroxidase substrate. The reaction was monitored and the absorbance read as described above.
CA15.3 and CEA serum measurements were made by The Doctors Laboratory (TDL, London, UK), an independent clinical pathology accredited laboratory. CA15.3 and CEA were quantified by the Roche
Modular method.
Serum VEGF levels were measured using a human ‘VEGF DuoSet ELISA development system kit’ (R&D Systems, Oxon, UK) according to the manufacturer’s instructions with the following alterations:
100 μl streptavidin-HRP from the kit was replaced with streptavidin conjugated to poly-horseradish peroxidase (Thermo Scientific) diluted 1 : 4000 in reagent diluent; patient sera were
diluted 1 : 10 in reagent diluent and assayed in duplicate; the uppermost point on the standard curve was 500 pg ml−1 (seven point standard curve). These alterations were made to enhance the
sensitivity of the assay to minimise the volume of patient serum required.
For the CDH5 ELISAs described above, two-fold serial dilutions of pooled reference serum with known CDH5 concentration were used to produce standard curves. Standard curves were measured in
duplicate on each 96-well plate, with the limit of detection defined as the mean average blank reading (wells containing all reagents but no serum) plus two s.d.’s. Levels of CDH5 and HPA
binding for the patient samples were determined by interpolation against the standard curves (after subtraction of blank readings from the standard curves and from the patient serum
absorbance values). Three quality control samples were assayed on each plate to enable inter-assay comparison. The highest absorbance reading falling within the linear detection range on the
standard curves was used to infer the relative protein levels, taking into account any dilution factor.
The CDH5, HPA, CDH5:HPA ratio, CA15.3, CEA and VEGF values were analysed as continuous variables using the Mann–Whitney test to assess biomarker discrimination between NSR and REC samples.
Univariate analysis using the Kruskal–Wallis or Mann–Whitney test was employed to assess associations between patient CDH5:HPA ratios and clinicopathological, treatment and lifestyle
factors. The same tests were used to establish whether an association between CDH5:HPA ratios and any of these factors was evident when comparing NSR patients with REC patients.
Using multiple logistic regression models, the clinicopathological variables shown in table one were built into models in a stepwise manner to determine their capability in prediction of
distant recurrence. The sensitivity, specificity and the negative and positive predictive values (NPV/PPV) were determined.
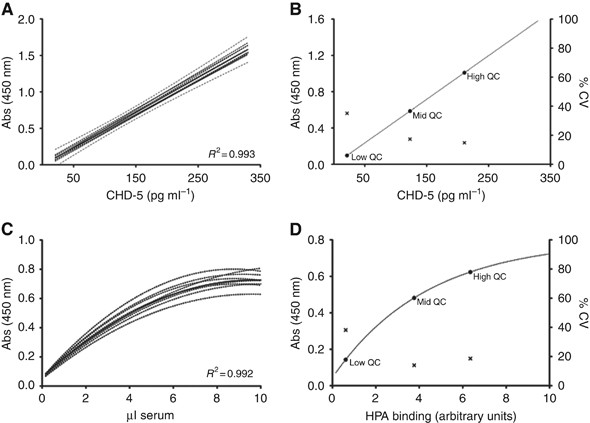
Levels of CDH5 were determined in breast cancer serum samples by interpolation from standard curves showing intra- and inter-assay coefficients of variation of 6.8% and 15.3%, respectively.
The highly reproducible nature of the CDH5 assay is further evidenced by them all falling within the 95% confidence interval of the combined mean of all curves, R2=0.993 (Figure 1A). To
allow inter-assay comparisons, three quality control serum samples were included on each 96-well plate, specifically selected to represent a range of CDH5 concentrations (Figure 1B). The
linear working range of the assay was 21–330 pg ml−1. As expected, the quality control sample with the lowest CDH5 concentration showed the greatest degree of variability, accordingly, the
patient sample dilution of the greatest optical density falling within the linear range of the standard curve was used to determine the CDH5 levels (Figure 1B). In all, 52 out of the 112
patient samples analysed had detectable CDH5 levels in both serum dilutions assayed. When the data were normalised to equivalent concentrations of serum, the coefficient of variation between
sample dilutions was 13.5% and general agreement between CDH5 concentrations measured at each dilution (1 in 50 and 1 in 250) was good (Spearman rank correlation coefficient=0.85, P