Power to detect qtl in a free-living polygynous population
- Select a language for the TTS:
- UK English Female
- UK English Male
- US English Female
- US English Male
- Australian Female
- Australian Male
- Language selected: (auto detect) - EN
Play all audios:
ABSTRACT Evolutionary biologists attempting to detect quantitative trait loci (QTL) in natural populations have thus far had to carry out some kind of cross with their study organism. Such
techniques often increase the probability of detecting linkage, but are impossible or undesirable in many populations. A potential way of overcoming this problem is to carry out linkage
studies in large complex pedigrees. In this paper we contrast the power to detect linkage in a complex pedigree of red deer (_Cervus elaphus_) with that of the widely used half-sib design.
When a QTL of magnitude 1 phenotypic standard deviation is segregating and completely linked to a marker, the extended pedigree has power of 0.67, whereas the half-sib design has power of
just 0.21. We conclude that detecting QTL may be possible in intensively studied natural populations, provided detailed life history data and good pedigree information are available. SIMILAR
CONTENT BEING VIEWED BY OTHERS SELECTION, RECOMBINATION AND POPULATION HISTORY EFFECTS ON RUNS OF HOMOZYGOSITY (ROH) IN WILD RED DEER (_CERVUS ELAPHUS_) Article Open access 17 February 2023
ISLAND DEMOGRAPHICS AND TRAIT ASSOCIATIONS IN WHITE-TAILED DEER Article 27 May 2024 EVALUATING REGIONAL HERITABILITY MAPPING METHODS FOR IDENTIFYING QTLS IN A WILD POPULATION OF SOAY SHEEP
Article Open access 23 May 2025 INTRODUCTION Evolutionary biologists have long been interested in genetic variation for fitness in natural populations. One unresolved issue is whether
genetic variation for fitness and fitness components is caused by many polygenes of small effect, or whether genes of major effect can segregate despite natural selection (Barton &
Turelli, 1989; Orr & Coyne, 1992). Recent attention has focused on the possibility of mapping genes for fitness in natural populations, given the advent of suitable markers, maps and
statistical methodology (Mitchell-Olds, 1995). However, very few studies have, as yet, attempted to do this, and none has managed it in an unmanipulated population actually _in_ the wild.
The vast majority of linkage mapping projects have taken place in humans, laboratory model organisms, e.g. _Drosophila_ (Shrimpton & Robertson, 1988), mouse (Keightley & Bulfield,
1993) or domestic species, e.g. cattle (Georges et al., 1995) and tomato (Paterson et al., 1988). A few mapping programmes have been carried out in ‘natural’ populations of plants, most
notably within the genus _Mimulus_ (e.g. Bradshaw et al., 1995; Lin & Ritland, 1997). However, these studies have taken place within artificial crosses, a technique which elevates the
amount of phenotypic and additive genetic variation segregating within the cross, relative to the situation in the wild. Furthermore, selective genotyping (Darvasi & Soller, 1992) may
have been employed. Both of these techniques improve the chances of detecting QTL but may be impossible in a large number of natural populations. Selective genotyping is applicable only when
a single trait (or several phenotypically highly correlated traits) is of interest, whereas in many populations it is neither desirable nor possible to perform crosses. In addition QTL
segregating within a cross do not necessarily segregate in a single wild population. Where it is not possible to create specific crosses, researchers might turn to an alternative
experimental design: the use of complex, extended pedigrees. To carry out a QTL mapping programme without manipulating a pedigree is analogous to complex disease mapping in human
populations, although considerably more difficult. To obtain a pedigree of a natural population is nontrivial. Additionally, genetic maps of wild species will not be as dense (with the
possible exception of wild mouse populations) as the human map. The biggest problem for QTL mappers of natural populations is a lack of power in the pedigrees available (if any) to actually
detect linkage. Considerable attention has been given in the animal breeding literature to the relative power of half-sib designs and more complicated family structures, in detecting QTL
(Weller et al., 1990; van der Beek et al., 1995). Weller et al. (1990) examined the power to detect QTL for the half-sib (or daughter) design and compared this to a three-generation
granddaughter design. In the daughter design each sire has a number of daughters by different dams. All animals are genotyped and progeny have recorded trait values. The alternative
granddaughter design was developed with dairy cattle in mind: it requires sires to have a medium to large number of sons, who in turn sire a large number of daughters. The sons of the sires
are genotyped and trait values of their daughters are recorded. Breeding values of sons are accurately estimated by taking daughter phenotypic means. Weller et al. (1990) conclude that
although not a particularly complex pedigree, the granddaughter design was a more powerful method than the half-sib design in detecting QTL. Additionally, less genotyping is required in
obtaining this enhanced power. Georges et al. (1995) successfully used this design to detect milk production QTL in dairy cattle. Human geneticists have also focused on the relative merits
of extended pedigrees vs. nuclear families for detecting linkage. The recent Genetics Analysis Workshop 10 (GAW10) set a challenge to a number of groups to detect QTL for an oligogenic trait
segregating in two simulated data sets, one containing nuclear families and the other an extended pedigree (Wijsman & Amos, 1997). The number of phenotypes and genotypes was equal for
both data sets. Those analyses that used the extended data set were generally more successful in detecting the simulated disease loci, estimated QTL location more accurately and detected
fewer false positives. Two properties of extended pedigrees lead to this increased power. First, there are more meioses in the extended pedigree than the nuclear family design for the same
number of genotypes. Secondly, marker phase is estimated more accurately over several generations than over one. Recent statistical advances have enabled geneticists to use information from
extended pedigrees rather than their constituent nuclear families or sibships (Almasy & Blangero, 1998). Approaches such as these may enable evolutionary biologists to search for QTL
without performing crosses within their study population. However, utilizing whole pedigrees does have disadvantages. Analyses can be computationally demanding, and statistical techniques
familiar to those using simple crosses, such as least squares, cannot be performed. In this paper we investigate, by simulation, the power of QTL analyses in a free-living red deer
population, using a large complex pedigree or the series of half-sibships that comprise it. The red deer on Rum, Inner Hebrides, Scotland have been intensively studied for over 25 years,
with life history data collected for over 2000 deer. The deer genome is now reasonably well mapped and includes over 600 markers of which 130 are microsatellites (Tate, 1997). In principle
it is possible to screen the Rum red deer for a large number of mapped, polymorphic markers and carry out a search for fitness-related QTL. The main purpose of this paper is to investigate
three questions about the power to detect QTL in this population. First, do small half-sibships contribute towards power? Secondly, do least squares and likelihood approaches give similar
estimates of power for the half-sib design? Thirdly, the main aim of the paper, do the complex pedigree and the half-sib design give similar estimates of power when using the likelihood
approach? If the complex pedigree gives greater power than the half-sib design then this approach may be useful in attempting to map QTL in the wild. METHODS THE STUDY POPULATION The deer in
the north block of Rum have been intensively studied since 1971 and are one of the best characterized free-living mammal populations in the world. For a review of the first decade of the
study and a description of the study site see Clutton-Brock et al. (1982). Since 1982 over 80% of new-born calves have been sampled for genetic purposes. Mother–offspring pairs in the
population are determined by observation in the field. Typing of over 1100 individuals for nine mapped microsatellite loci and three allozymes has revealed no mis-assignments of maternity
(Marshall et al., 1998). Paternity was assigned using CERVUS (Marshall et al., 1998), a program for inferring paternity in unmanaged populations at any required statistical confidence.
CERVUS uses population characteristics including allele frequencies to calculate, by simulation, likelihood thresholds for determining paternity at the desired confidence. 875 calves born
between 1982 and 1996 were analysed of which 475 calves were assigned sires with 80% confidence and 203 with 95% confidence (Marshall et al., 1998). The polygynous mating system of red deer
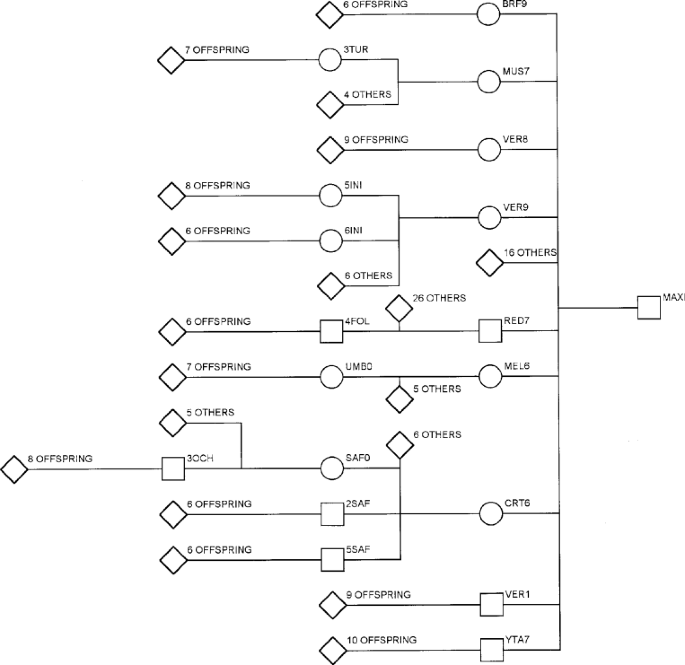
results in large numbers of half-sibs, but relatively few full-sibs. PEDIGREE USED IN SIMULATION STUDIES The Rum pedigree was visualized using PEDVIEW (Kinghorn, 1994). Features such as
large half-sibships and successful individuals were identified. One particular stag, MAXI, was investigated more fully for a number of reasons. First, MAXI was extremely successful, siring
21 calves at 95% confidence and a further 12 at 80% confidence, for most of whom we have life history data. Secondly, a number of MAXI’s offspring were extremely successful themselves (see
Fig. 1) and to date MAXI has at least 416 known descendants since his birth in 1971. Thirdly, MAXI was an F1 between a Rum hind and a mainland stag (Lincoln et al., 1973) and so may have
introduced novel additive genetic variation into the population. For the same reason marker heterozygosity may be higher within this specific pedigree. For the purposes of our simulations we
have analysed the MAXI pedigree. DNA samples and life history data are available for all individuals used in our simulations. The 416 individuals are spread over six generations. In total
there are 73 sibships ranging in size from two to 27. The alternative half-sib design with which we compared the MAXI pedigree was simply the composite half- and full-sibships within the
larger pedigree. Breaking down the complex pedigree in this way violates the assumption that the nuclear families are independent, but analysis is simplified such that least squares methods
can be employed. SIMPLE LEAST-SQUARES-BASED ANALYSIS OF POWER A quick method to estimate the power to detect QTL in the constituent half-sibships of the larger pedigree was developed by one
of us (P.V.) using computer simulation. We used this ‘Weller approach’ to investigate whether small sibships contribute to power, and also to compare the power of this approach with a
likelihood approach for a half-sib design. This analysis is an extension of that used by Weller et al. (1990) when evaluating the daughter design, but allows for sibships of unequal size. In
the balanced half-sib design used by Weller et al. (1990), the distribution of the test statistic under both the null hypothesis (no QTL segregating) and the alternative hypothesis can be
approximated by a central and a noncentral χ2, respectively. With unequal family sizes, the test statistic under the alternative hypothesis is not obvious, and we therefore use the following
approach. For each replicated population the sum of squares attributable to the marker contrasts within sires was sampled by: 1 determining whether each sire is homozygous or heterozygous
at the QTL, by sampling from a binomial distribution; 2 binning each progeny into one or other marker allele class (all sires are heterozygous for the marker), again by sampling from a
binomial distribution; 3 sampling the means of each marker class from a normal distribution with the mean difference between the marker classes equal to the QTL effect. The squared
difference between the means, standardized by the variance of the difference between the two means, is a draw from a noncentral χ2 distribution. It was thus assumed that the within-sire
variance was known (or estimated without error). Summing this marker contrast sum of squares across all sires gives the test statistic. Power is calculated by determining the probability of
this test statistic exceeding a central χ2 of Type I error α, with degrees of freedom equal to the number of sires which have progeny in both marker classes. Unlike Weller et al. (1990) we
have investigated half-sibships of differing size, as will be the case for most natural populations. In addition, we have taken into account the finite sampling of progeny group sizes for
each marker class. We have assumed that all sires are heterozygous for the marker allele and that there is no recombination between marker and trait loci. We used the following parameter
values for simulations. The QTL was assumed to be biallelic, with each allele at frequency 0.5. QTL magnitude was varied in increments of 0.1 of a within-QTL genotype phenotypic standard
deviation, so that the difference between the heterozygote and either homozygote was 0.5–1.0 SD. Polygenic heritability was 0.5. We examined the effect of using all sibships (two sibs or
more) or those containing greater than three, four, or five sibs, on the power of detecting linkage. Ten thousand replications were performed throughout. SIMLINK PROGRAM Although the Weller
approach gives a rapid and accurate estimate of power within the half-sib design, it cannot be used to analyse more complex pedigrees. To perform power comparisons between the extended
pedigree and the half-sib designs (the main purpose of this paper) we used the likelihood-based program SIMLINK (Boehnke, 1986; Ploughman & Boehnke, 1989). SIMLINK also enables
investigation of the effects of marker heterozygosity and recombination on power. SIMLINK tests whether a segregating major gene can be detected when linked to a marker, compared to the null
hypothesis of a major gene segregating but being unlinked. Note that SIMLINK and the Weller approach are performing subtly different statistical tests. The Weller approach tests for a QTL
segregating against the null hypothesis of no QTL, whereas SIMLINK tests for a QTL linked to a marker, compared with a QTL segregating but unlinked to the marker. The implications of this
difference are discussed. We compared the power to detect linkage in the extended pedigree and its constituent sibships, whilst also investigating the effect of QTL magnitude, marker
heterozygosity and recombination between marker and QTL. One hundred replications were performed throughout. SIMLINK PARAMETERS 1 QTL magnitude: this was as for the Weller approach. 2
Recombination fraction: the distance between marker and trait locus was set to 0, 10 or 20 cM. 3 Marker heterozygosity: the number of marker alleles was varied from two to nine with all
alleles at equal frequency. This meant that marker heterozygosity varied from 0.5 to 0.89. Unlike the Weller approach, a marker heterozygosity of unity is impossible with SIMLINK. However,
the parameter values used in SIMLINK are more realistic. In practice no single marker has a heterozygosity of unity. SIGNIFICANCE THRESHOLDS The relationship between the χ2-test of the
Weller approach and the likelihood test of SIMLINK is complicated, but the same significance level for both is essential to make a comparison between the two approaches for a half-sib
design. Baret et al. (1998) examined the relationship between the test statistics for the _F_-statistic (or its approximation by χ2) and a likelihood ratio test, for the half-sib design.
They showed for the null hypothesis of no QTL segregating, that a likelihood ratio test (or LOD score) follows an approximate distribution of half times 0 and half times a χ2 with d.f=1.
This can be approximated by using a χ2 distribution with 1 d.f. and doubling the probability value. So, if SIMLINK is used to test the power of obtaining a LOD of 3.0 (corresponding to a
probability of 0.0001) then to perform the equivalent test with the Weller approach a _P_-value of 0.00005 (half of 0.0001) should be used. RESULTS CONTRIBUTION OF SMALLER SIBSHIPS TO POWER
We used the Weller approach to examine the effect of the smaller half-sibships on the power to detect linkage to a QTL (see Table 1). Of the 73 sibships within the MAXI pedigree, 31 of them
only had two sibs and 17 just three sibs. Power was greatest when all half-sibships were used, but the contribution from the half-sibships with fewer than five progeny was small. In small
sibships all offspring often inherit the same sire marker allele. In consequence the average number of informative sires will vary across replications of the simulation, and the Type 1
threshold will not be constant. As the smaller families contributed little power, all subsequent Weller simulations were performed with the 18 half-sibships containing five or more
offspring. This meant that a single Type 1 threshold could be used (assuming that all 18 sires were informative; see Table 1), and comparisons between Weller et al.’s (1990) least squares
approach and the likelihood method of SIMLINK could be made. COMPARISON OF THE WELLER AND SIMLINK APPROACHES FOR THE HALF-SIB DESIGN Both methods were used to investigate the power of
detecting linkage to a QTL for the constituent half-sib design. For a QTL of effect 0.5–1.0 phenotypic standard deviation, with no recombination between marker and trait loci, both methods
yielded similar results (Table 2), although the Weller approach tended to give slightly higher power. This is perhaps unsurprising given that the Weller approach makes the assumption that
all sires are heterozygous at the marker allele, whereas for our SIMLINK simulations we used a marker heterozygosity of 0.89 (see Methods). The maximum discrepancy in power between the two
programs was 0.08. COMPARISON OF MEAN LOD SCORE AND POWER BETWEEN AN EXTENDED PEDIGREE AND ITS CONSTITUENT SIBSHIPS Table 3 compares the results obtained from SIMLINK using the extended
pedigree and using the constituent half-sibships analysed separately. Mean LOD score and power are compared when recombination between marker and trait locus is set to 0, 10 or 20 cM. Figure
2 illustrates the effect of QTL magnitude on mean LOD for all six scenarios considered (extended and half-sib pedigrees at three different recombination fractions). The mean LOD score was
always greater for the extended pedigree than for the equivalent half-sib design. The relative difference between the two designs was greater when recombination fraction was lower. At 0 cM
the extended pedigree mean LOD was 2.5–3.0 times greater than for the half-sib design, whereas at 20 cM the ratio was only 1.5–2.0. The relationship between pedigree design and power was
similar to that of pedigree design and mean LOD score. Figure 3 illustrates the power of obtaining LOD scores in the range 0.5–3.0 for some of the models tested. When there was no
recombination between the marker and the QTL, the extended pedigree had more than double the power of the half-sib design to obtain a LOD score of 2.0 and above, regardless of QTL effect.
Power rapidly decreased with increasing recombination fraction between marker and QTL for both designs. EFFECT OF MARKER HETEROZYGOSITY ON MEAN LOD SCORE AND POWER We also examined the
effect of marker heterozygosity on mean LOD score and power, for both extended and half-sib designs (Table 4). When marker heterozygosity was reduced from 0.89 to 0.50, mean LOD score for
both designs was more than halved. However, the extended pedigree still had a mean LOD score more than 2.5 times greater than that of the half-sib design. At the lower marker heterozygosity
(0.50), the power to obtain a LOD score of 3.0 had decreased from the original value of 0.51 to just 0.10 for the extended pedigree. DISCUSSION We have demonstrated that the probability of
detecting QTL in an unmanaged free-living population of red deer is greatly increased if an extended pedigree rather than a simple half-sib design is used. This is the first time that
complex pedigrees have been considered for mapping QTL in wild populations and the results are encouraging. A number of field studies could now produce pedigrees several generations deep,
and similar to the one we use in our analysis. Why does the extended pedigree yield greater power than the half-sib design? The extended pedigree uses genotype and phenotype information on
all individuals, and by tracing marker alleles down the pedigree, calculates the likelihood of a major gene segregating. In other words, both between- and within-family information is
considered. In contrast, the half-sib design uses only within-family information. With a real QTL mapping data set, one would probably perform a test that compares a model of QTL and
background polygenic effect against a model which had only a polygenic effect. Our comparison of a half-sib design and an extended pedigree used a model of QTL linked vs. QTL present but
unlinked. Our own data, and also those of Le Roy & Elsen (1995) suggest that the former test may give a slightly higher test statistic than the SIMLINK comparison. In our half-sib
simulations the Weller approach gave marginally higher power than SIMLINK, although this may be caused by the slightly higher marker heterozygosity for the Weller approach. Le Roy &
Elsen (1995) also demonstrate that a LOD score approach (testing QTL linked vs. QTL unlinked) gives lower power relative to a Weller approach, particularly for a three-generation design
compared to a half-sib design. This would suggest that our test statistic for the extended pedigree may be downwardly biased, making our comparison between the extended pedigree and half-sib
design conservative. It should also be pointed out that our approach does not account for any polygenic variation that may be segregating. However, there is no evidence that ignoring a
polygenic effect inflates our test statistic. Knott & Haley (1992) simulated a polygenic component in a full-sib design and showed that a QTL linked vs. QTL unlinked test gave a _lower_
test statistic than one where polygenic effect was fitted (QTL linked + polygenic component vs. QTL unlinked + polygenic component). Again this suggests that our test may be conservative. A
contentious area of QTL mapping is that of significance thresholds. Lander & Kruglyak (1995) discussed the criteria that should be used for assigning linkage. A common problem is that
when carrying out a genome-wide scan for QTL, multiple testing leads to false assignation of linkage because of Type I error. However, imposing too strict a value for significance may
wrongly reject any suggestions of linkage that are found (Type II error). Traditionally a LOD score of 3 has been used to assign linkage. However, Lander & Kruglyak (1995) suggest a
different approach: the use of a genome-wide significance level to find what they term ‘significant linkage’. This is defined as statistical evidence expected 0.05 times in a genome-wide
scan. If one were to carry out a genome-wide scan using 100 markers (a realistic number of markers for a natural population screening), an experiment-wide error rate of 0.05 could be
approximated using a Bonferroni correction so that Using the approach of Baret et al. (1998) this significance level corresponds to a LOD score of 2.34. In other words, rather than use a LOD
score of 3.0 to assign linkage, a LOD score of 2.34 could be used for an experiment-wide significance level of 0.05. For the MAXI pedigree this equates to a power of about 0.67 (rather than
0.51) when a QTL of effect 1.0 SD is segregating, and there is no linkage between marker and QTL (see Fig. 3). Although the power to detect QTL is high only in a somewhat idealized
situation (highly polymorphic markers, QTL of very large effect, and low recombination fraction between marker and QTL), further considerations may increase this power. In a real mapping
study researchers may have prior information on environmental factors influencing the trait of interest. Controlling for these variables will serve to increase the proportion of the residual
variation explained by the QTL. In other words, the heritability of the trait determined by the QTL will increase, as will the power to detect the QTL. Mapping projects in wild populations
may also be able to draw on previous work carried out in closely related laboratory or farmed species where QTL for a trait of interest have been identified. If one knew the likely location
of a QTL, then extra markers could be screened in that chromosomal region, hence reducing the recombination fraction between the QTL and marker(s). Alternatively only markers linked tightly
to the candidate region could be typed and less stringent significance thresholds used. Again, this would increase the power to detect QTL. There is increasing evidence from the plant
breeding literature that QTL affecting particular traits are found in syntenic genomic regions across species (Kearsey & Farquhar, 1998). In our simulations we have performed linkage
analysis only with single-point markers. Interval mapping and multipoint analysis would reduce much of the loss of power observed when recombination occurs between marker and QTL (Lander
& Botstein, 1989; Knott et al., 1996). For example, when a QTL of effect 1.0 SD is segregating and there is no recombination, the power for a mean LOD > 3.0 is 0.51 in the extended
pedigree. At 10 cM the power is only 0.19, and at 20 cM just 0.03. Interval mapping would partially alleviate this problem, the effect of which is most noticeable when one has markers spaced
at wide intervals (Fulker & Cardon, 1994), as will be the case in most studies of natural populations. Interval mapping has the additional advantage over single-point mapping that other
QTL parameters such as magnitude and location can be estimated (Lander & Botstein, 1989). Most interval mapping procedures developed thus far are applicable to sib-pair (Lander &
Botstein, 1989; Fulker & Cardon, 1994) or half-sib (Haley & Knott, 1992; Knott et al., 1996) families. However, our simulations suggest that QTL detection in unmanipulated natural
populations may be possible only if whole, complex pedigrees can be analysed. A recent study (Almasy & Blangero, 1998) described a method in which large complex pedigrees can be analysed
by multipoint linkage. The number of alleles shared identically by descent (IBD) at marker loci is used to estimate genes IBD at various points along a chromosome for all relative pairs
within the pedigree. Variance-component maximum likelihood linkage analysis is then performed on the overall pedigree to indicate the presence of a QTL. As new statistical approaches like
these are developed, QTL mapping in natural populations will become a possibility. As expected, marker heterozygosity had a significant impact on ability to detect QTL. For both the extended
and the flat pedigrees, a heterozygosity of 0.8 gave about twice the LOD score as one of 0.5. Microsatellite loci typically have heterozygosity values in the range 0.5–0.8, although this
varies among species and populations. In species with a very dense map, such as the mouse, it may be possible to use highly variable markers exclusively. In summary, we conclude that QTL
detection in natural populations is possible, but unlikely unless loci of very large effect are segregating. However, if this is the case, those studies with reasonable sample sizes will
benefit greatly from being pedigreed for several generations. Mapping of QTL may be possible with pedigrees of well under 1000 individuals. We look forward to the development and application
of new, sophisticated statistical software, and remain cautiously optimistic that mapping programmes such as these will be realized in the next few years. REFERENCES * Almasy, L. and
Blangero, J. (1998). Multipoint quantitative-trait linkage analysis in general pedigrees. _Am J Hum Genet_, 62: 1198–1211. Article CAS PubMed PubMed Central Google Scholar * Baret, P.
V., Knott, S. A. and Visscher, P. M. (1998). On the use of linear regression and maximum likelihood for QTL mapping in half-sib designs. _Genet Res_, 72: 149–158. Article CAS PubMed
Google Scholar * Barton, N. H. and Turelli, M. (1989). Evolutionary quantitative genetics: how little do we know? _Ann Rev Genet_, 23: 337–370. Article CAS PubMed Google Scholar *
Boehnke, M. (1986). Estimating the power of a proposed linkage study: a practical computer simulation approach. _Am J Hum Genet_, 39: 513–527. CAS PubMed PubMed Central Google Scholar *
Bradshaw, H. D. Jr, Wilbert, S. M., Otto, K. G. and Schemske, D. W. (1995). Genetic mapping of floral traits associated with reproductive isolation in monkeyflowers (_Mimulus_). _Nature_,
376: 762–765. Article CAS Google Scholar * Clutton-Brock, T. H., Guinness, F. E. and Albon, S. D. (1982) _Red Deer: Behaviour and Ecology of Two Sexes_. Edinburgh University Press,
Edinburgh. Google Scholar * Darvasi, A. and Soller, M. (1992). Selective genotyping for determination of linkage between a marker locus and a quantitative trait locus. _Theor Appl Genet_,
85: 353–359. Article CAS PubMed Google Scholar * Fulker, D. W. and Cardon, L. R. (1994). A sib-pair approach to interval mapping of quantitative trait loci. _Am J Hum Genet_, 54:
1092–1103. CAS PubMed PubMed Central Google Scholar * Georges, M., Nielsen, D., Mackinnon, M., Mishra, A., Okimoto, R. and Pasquino, A. T. _et al_1995). Mapping quantitative trait loci
controlling milk production in dairy cattle by exploiting progeny testing. _Genetics_, 139: 907–920. CAS PubMed PubMed Central Google Scholar * Haley, C. S. and Knott, S. A. (1992). A
simple regression method for mapping quantitative trait loci in line crosses using flanking markers. _Heredity_, 69: 315–324. Article CAS PubMed Google Scholar * Kearsey, M. J. and
Farquhar, A. G. L. (1998). QTL analysis in plants; where are we now? _Heredity_, 80: 137–142. Article PubMed Google Scholar * Keightley, P. D. and Bulfield, G. (1993). Detection of
quantitative trait loci from frequency changes of marker alleles under selection. _Genet Res_, 62: 195–203. Article CAS PubMed Google Scholar * Kinghorn, B. P. (1994). Pedigree Viewer –
a graphical utility for browsing pedigreed data sets. In: Smith, C., Gavora, J. S., Benkel, B., Chesuais, J., Fairfull, W. and Gibson, J. P. (eds) _5th World Congress on Genetics Applied to
Livestock Production_. pp. 85–86. University of Guelph, Canada. Google Scholar * Knott, S. A. and Haley, C. S. (1992). Maximum likelihood mapping of quantitative trait loci using full-sib
families. _Genetics_, 132: 1211–1222. CAS PubMed PubMed Central Google Scholar * Knott, S. A., Elsen, J. M. and Haley, C. S. (1996). Methods for multiple-marker mapping of quantitative
trait loci in half-sib populations. _Theor Appl Genet_, 93: 71–80. Article CAS PubMed Google Scholar * Lander, E. S. and Botstein, D. (1989). Mapping Mendelian factors underlying
quantitative traits using RFLP linkage maps. _Genetics_, 121: 185–199. CAS PubMed PubMed Central Google Scholar * Lander, E. and Kruglyak, L. (1995). Genetic dissection of complex
traits: guidelines for interpreting and reporting linkage results. _Nature Genet_, 11: 241–247. Article CAS PubMed Google Scholar * Leroy, P. and Elsen, J. M. (1995). Numerical
comparison between powers of maximum likelihood and analysis of variance methods for QTL detection in progeny test designs: the case of monogenic inheritance. _Theor Appl Genet_, 90: 65–72.
Article CAS Google Scholar * Lin, J. -Z. and Ritland, K. (1997). Quantitative trait loci differentiating the outbreeding _Mimulus guttatus_ from the inbreeding _M. platycalyx_.
_Genetics_, 146: 1115–1121. CAS PubMed PubMed Central Google Scholar * Lincoln, G. A., Guinness, F. E. and Fletcher, T. J. (1973). History of a hummel – Part 3. Sons with antlers.
_Deer_, 3: 26–31. Google Scholar * Marshall, T. C., Slate, J., Kruuk, L. E. B. and Pemberton, J. M. (1998). Statistical confidence for likelihood-based paternity inference in natural
populations. _Mol Ecol_, 7: 639–655. Article CAS PubMed Google Scholar * Mitchell-Olds, T. (1995). The molecular basis of quantitative genetic variation in natural populations. _Trends
Ecol Evol_, 10: 324–328. Article CAS PubMed Google Scholar * Orr, H. A. and Coyne, J. A. (1992). The genetics of adaptation: a reassessment. _Am Nat_, 140: 725–742. Article CAS PubMed
Google Scholar * Paterson, A. H., Lander, E. S., Hewitt, J. D., Peterson, S., Lincoln, S. E. and Tanksley, S. D. (1988). Resolution of quantitative traits into Mendelian factors by using
a complete linkage map of restriction fragment length polymorphisms. _Nature_, 335: 721–726. Article CAS PubMed Google Scholar * Ploughman, L. M. and Boehnke, M. (1989). Estimating the
power of a proposed linkage study for a complex genetic trait. _Am J Hum Genet_, 44: 543–551. CAS PubMed PubMed Central Google Scholar * Shrimpton, A. E. and Robertson, A. (1988). The
isolation of polygenic factors controlling bristle score in _Drosophila melanogaster_ II. Distribution of third chromosome bristle effects within chromosome sections. _Genetics_, 118:
445–459. CAS PubMed PubMed Central Google Scholar * Tate, M. L. (1997). _Evolution of Ruminant Chromosomes_. Ph.D. Thesis, University of Otago, New Zealand. * van Der Beek, S., van
Arendonk, J. A. M. and Groen, A. F. (1995). Power of two- and three-generation QTL mapping experiments in an outbred population containing full-sib or half-sib families. _Theor Appl Genet_,
91: 1115–1124. Article CAS PubMed Google Scholar * Weller, J. I., Kashi, Y. and Soller, M. (1990). Power of daughter and granddaughter designs for determining linkage between marker loci
and quantitative trait loci in dairy cattle. _J Dairy Sci_, 73: 2525–2537. Article CAS PubMed Google Scholar * Wijsman, E. M. and Amos, C. I. (1997). Genetic analysis of simulated
oligogenic traits in nuclear and extended pedigrees: summary of GAW10 contributions. _Genet Epidemiol_, 14: 719–735. Article CAS PubMed Google Scholar Download references
ACKNOWLEDGEMENTS We thank all members of the Rum red deer project, in particular T. H. Clutton-Brock, S. D. Albon, F. E. Guinness and the various field assistants who have collected
individual specific life-history data. We also thank the numerous volunteers who have helped them over the duration of the project. We thank SNH and its predecessor NCC for permission to
work on Rum. The long-term study has been funded by NERC and BBSRC. Chris Haley, Bill Hill, Marg Mackinnon, Dave Coltman and an anonymous referee made helpful comments on earlier versions of
the manuscript. J.S. is funded by a BBSRC postgraduate studentship. AUTHOR INFORMATION AUTHORS AND AFFILIATIONS * Institute of Cell, Animal and Population Biology, University of Edinburgh,
West Mains Road, Edinburgh, EH9 3JT, UK J Slate & J M Pemberton * Institute of Ecology and Resource Management, University of Edinburgh, West Mains Road, Edinburgh, EH9 3JG, UK P M
Visscher Authors * J Slate View author publications You can also search for this author inPubMed Google Scholar * J M Pemberton View author publications You can also search for this author
inPubMed Google Scholar * P M Visscher View author publications You can also search for this author inPubMed Google Scholar CORRESPONDING AUTHOR Correspondence to J Slate. RIGHTS AND
PERMISSIONS Reprints and permissions ABOUT THIS ARTICLE CITE THIS ARTICLE Slate, J., Pemberton, J. & Visscher, P. Power to detect QTL in a free-living polygynous population. _Heredity_
83, 327–336 (1999). https://doi.org/10.1038/sj.hdy.6885830 Download citation * Received: 06 April 1999 * Accepted: 21 May 1999 * Published: 01 September 1999 * Issue Date: 01 September 1999
* DOI: https://doi.org/10.1038/sj.hdy.6885830 SHARE THIS ARTICLE Anyone you share the following link with will be able to read this content: Get shareable link Sorry, a shareable link is not
currently available for this article. Copy to clipboard Provided by the Springer Nature SharedIt content-sharing initiative KEYWORDS * _Cervus elaphus_ * genetic mapping * major gene *
natural population * pedigree * red deer